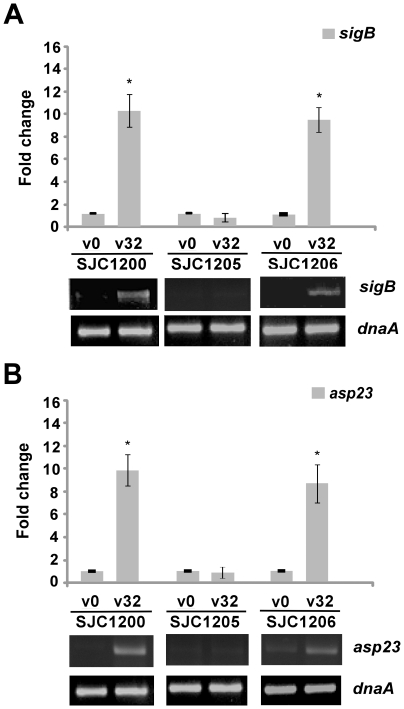
Figure 2. Expression of sigB upon vancomycin treatment.
Changes in the transcription levels of the (A) sigB and (B) asp23 genes upon vancomycin treatment determined using qRT-PCR. Representative agarose gel electrophoresis images of RT-PCR assays are shown below the bar chart. V0 and V32: 0 and 32 µg/ml vancomycin, respectively. * P<0.05 compared to the untreated control cells.

