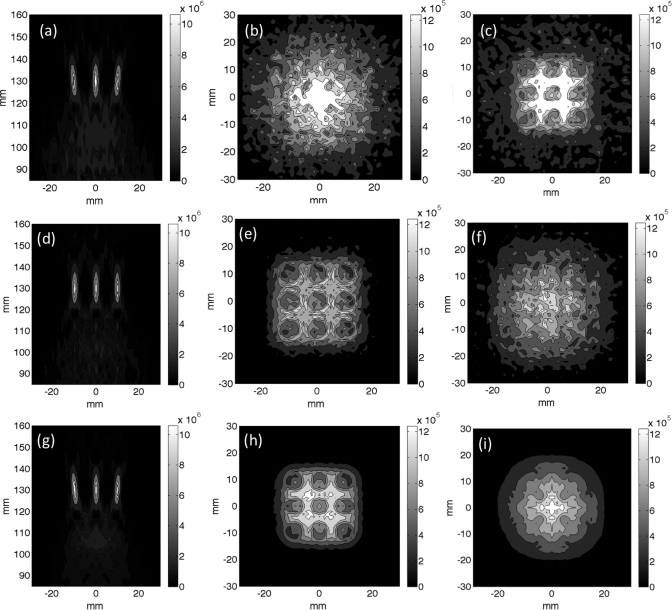
Figure 3.
Superposition of the simulated power deposition patterns used in the thermal simulations presented in Figs. 24 for the nine-point raster trajectory. (a)–(c) Superimposed beam patterns for the electronically steered trajectory for (a) an axial slice, (b) transverse slice 1.5 cm proximal to the focal plane, and (c) transverse slice 2.5 cm proximal to the focal plane. (d)–(f) Superimposed beam patterns for the mechanically steered trajectory for (d) an axial slice, (e) transverse slice 1.5 cm proximal to the focal plane and (f) transverse slice 2.5 cm proximal to the focal plane. (g)–(i) Superimposed beam patterns for the fully sampled transducer electronically steered trajectory for (g) an axial slice, (h) transverse slice 1.5 cm proximal to the focal plane and (i) transverse slice 2.5 cm proximal to the focal plane. All scale bars have the units of Watts per cubic meter.

