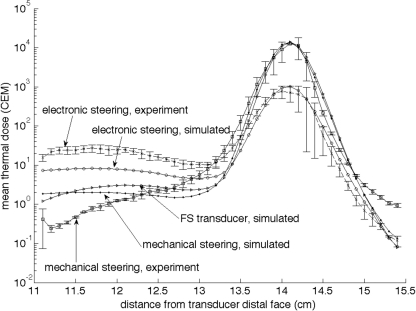
Figure 4.
Log plot of the mean of the 25 voxels with the highest thermal dose (CEM43 °C) accumulated in planes perpendicular to the ultrasound beam’s axis during the nine-position raster trajectory as a function of distance from the transducer face. The error bars for the experimental data at each point represent one standard deviation (n = 3). The focal plane is located at z = 14 cm. Both simulated and experimental data are shown for both electronic and mechanical steering. The simulation of the electronically steered fully sampled (FS) transducer is also shown.

