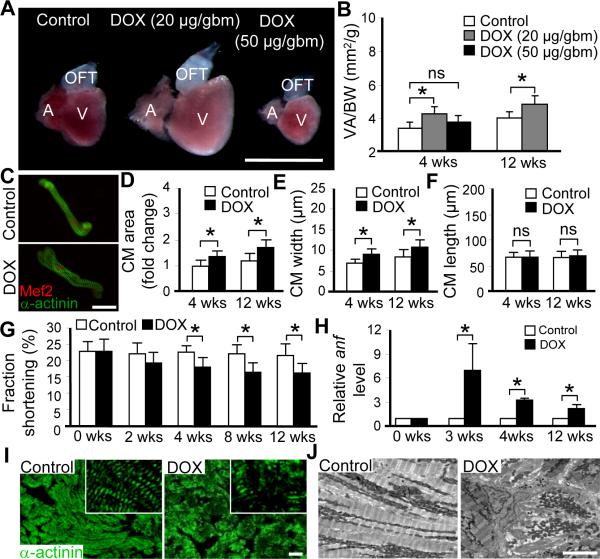
Figure 1. DOX-induced cardiomyopathy in zebrafish.
A, Representative images of dissected hearts from casper fish at 4 weeks post-injection with low (20 μg/gbm) or high (50 μg/gbm) dose of doxorubicin (DOX). Scale bar=1 mm. B, Quantification of the ventricle area to body weight index (VA/BW) showed heart enlargement at both 4 and 12 weeks post-DOX (20 μg/gbm) injection. C, Representative images of single cardiomyocyte (CM) dissociated from fish hearts at 12 weeks post-DOX (20 μg/gbm) injection. CMs were co-stained with α-actinin and Mef2. Scale bar=20 μm. D, Quantification of CM area to show that CM size was increased in fish hearts at both 4 and 12 weeks post-DOX (20 μg/gbm) injection, which could be explained by increased CM width (E), but not CM length (F). G, Time courses of fraction shortening (FS) measuring using casper;Tg(cmlc2:nuDsRed) fish after 20 μg/gbm DOX injection. Significantly decreased FS was detected at 4 weeks and thereafter post-DOX injection. H, Quantitative RT-PCR showing re-activated expression of atrial natriuretic factor (anf) in 20 μg/gbm DOX-induced cardiac remodeling process. I, α-actinin antibody staining to show muscular disarray at 12 weeks post 20 μg/gbm DOX injection. Insets are images of higher magnification. Scale bar=20 μm. J, Transmission electron microscopy (TEM) verified muscular disarray and myofibril loss in fish hearts at 6 months post 20 μg/gbm DOX injection. Scale bar=5 μm. V, ventricle; A, atrium; OFT, outflow tract. *P<0.05.

