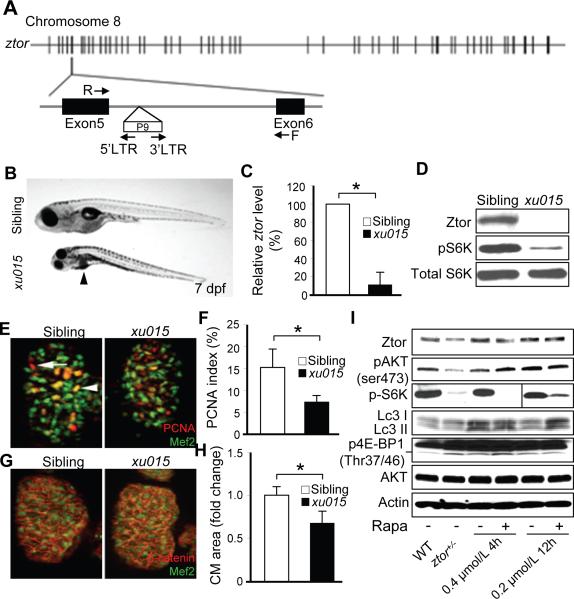
Figure 3. Isolation of a zebrafish target of rapamycin hypomorphic mutant: ztorxu015.
A, A P9 insertion was inserted within the 5th intron of the zebrafish target of rapamycin (ztor) gene at chromosome 8 in the ztorxu015 mutant. Locations of the primers used in LM-PCR and genotyping are indicated by arrows. B, The homozygous ztorxu015 mutant (ztor−/−) embryos appeared to be smaller compared to their normal siblings and displayed dark liver phenotypes at 7 days post-fertilization (dpf). Arrowheads indicate location of the liver. C, Quantificative RT-PCR revealed that the mRNA level of ztor was reduced by about 90% in the ztor−/− compared to that in normal siblings at 7 dpf. D, Western blot analysis confirmed a dramatic reduction of Ztor protein in the ztor−/− mutant at 7 dpf. In addition, phosphor-ribosomal S6K was also dramatically reduced, while the total ribosomal S6K level remained unchanged in the ztor−/− mutant. E, Representative images of dissected fish hearts at 7 dpf after co-immunostained with Mef2 (green) to label CMs and PCNA (red) to label proliferative cells. Scale bar=10 μm. Arrowhead indicates a proliferating CM. Arrow indicates a proliferating non-CM. F, Quantification of CM proliferation index represented in (E). G, Representative images of dissected fish hearts at 7 dpf after co-immunostained with Mef2 (green) and β-catenin (red) to define borders of CMs. H, Quantification of CM cell size represented in (G). I, Expression levels of total Ztor protein and its downstream branches of TORC1 and TORC2 in 6-month old ztorxu015 heterozygous fish (ztor+/−) compared to that in wild type siblings treated with or without rapamycin (0.4 μmol/L 4 h daily or 0.2 μmol/L 12 h daily for consecutive 7 days). p4E-BP1 level is indicated by the lower band. *P<0.05.

