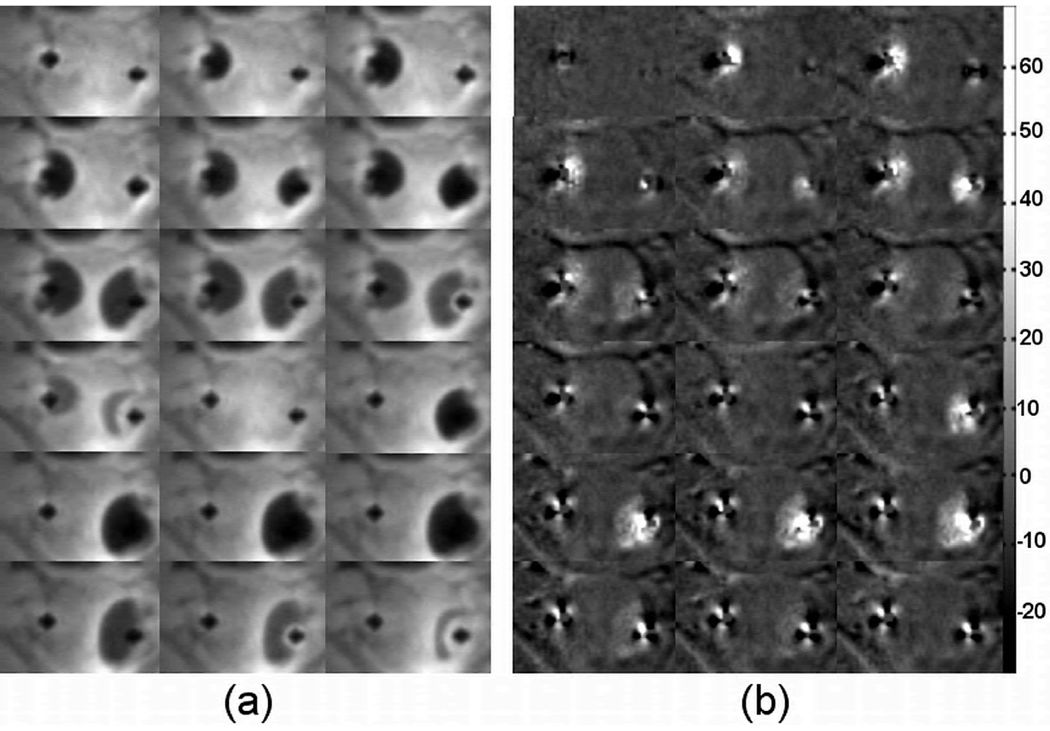
Fig. 4.
A series of magnitude images (a) and the corresponding phase shift images during the same cryoablation experiment shown in Fig. 3. As can be clear see in the magnitude images, the left side of the prostate experience on freeze-thaw cycle, while the right side experience two. The same pattern is seen in the phase shift images. The colorbar shows the phase shift in degrees.

