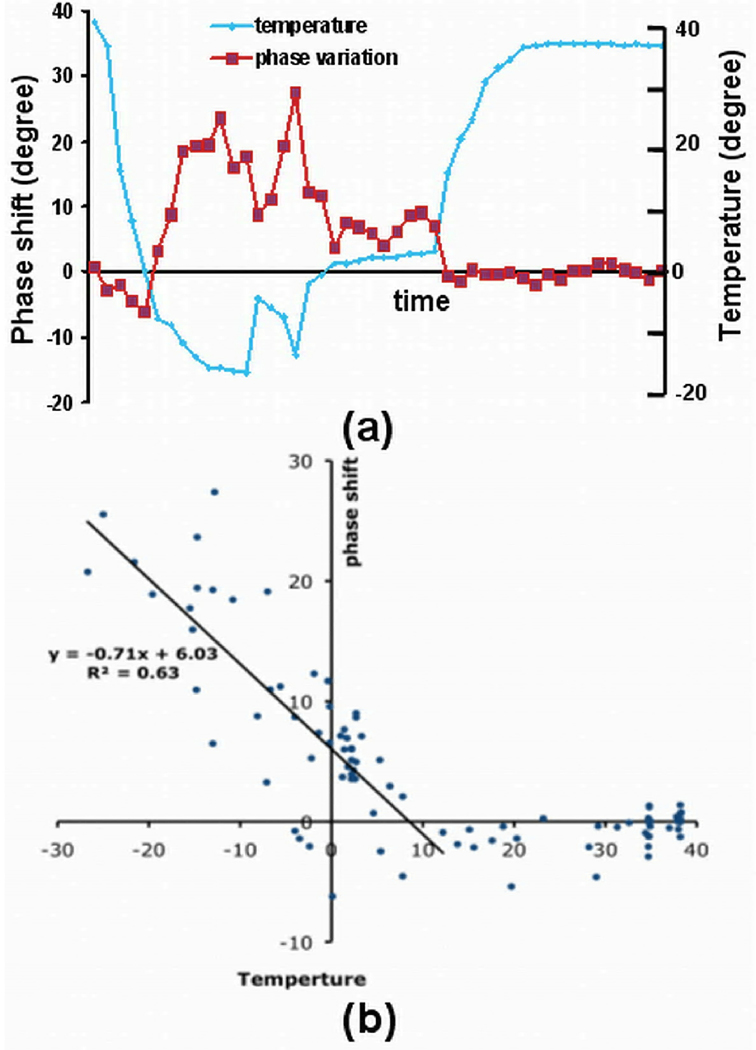
Fig. 5.
Plots show the relationship between phase shift (degree) and the corresponding readings (°C) from nearby temperature sensors in the same experiment as shown in Fig 4. (a) Phase shift and the corresponding readings from a nearby temperature sensor in a ROI near cryoprobe 1. (b) Phase shift were plotted against temperature in two ROIs near the two cryoprobes. A linear relationship is shown at low temperature.

