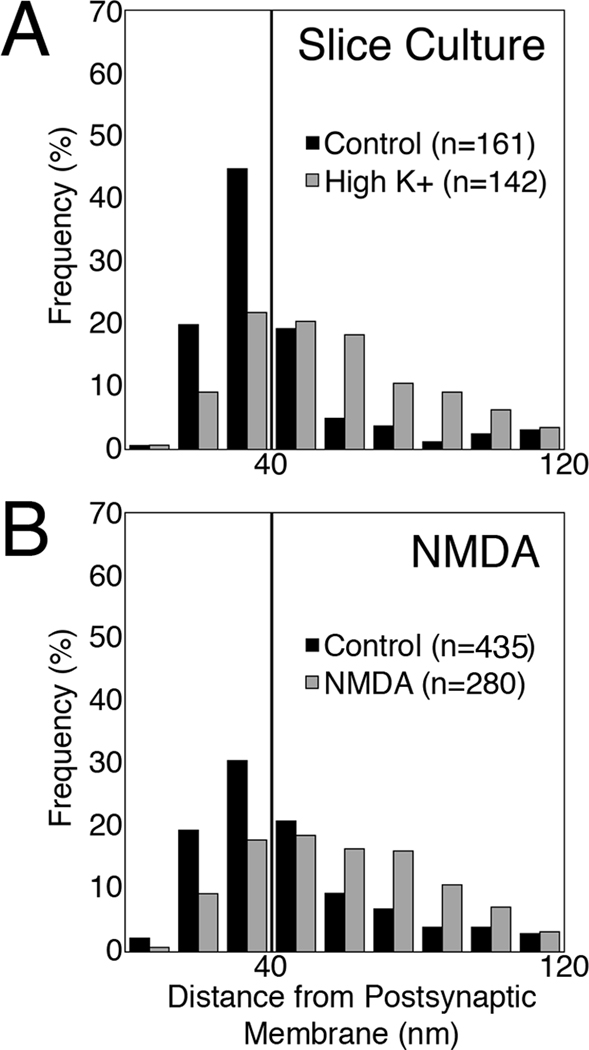
Fig. 7.
Histograms showing the distribution of label for SynGAP in hippocampal slice cultures (A) under control (black bars) and depolarizing conditions (gray bars), and in dissociated hippocampal cultures (B) under control conditions (black bars) and after two minutes of treatment with 30 µM NMDA (gray bars). The vertical line denotes the boundary between the PSD core and the contiguous network. Both histograms showed significant shifts after treatment (P < 0.0001, Wilcoxin-Mann-Whitney rank sum test).

