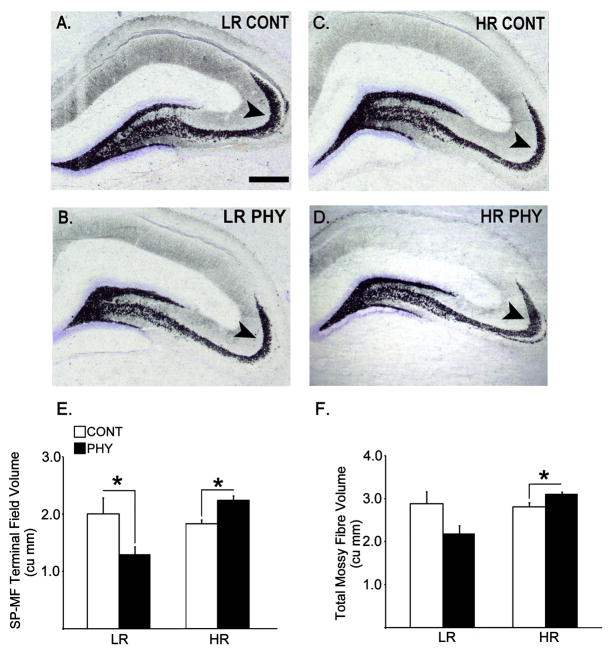
Figure 6.
Coronal hemisections of the dorsal hippocampus showing Timm-stained mossy fibre terminal fields that are counterstained by cresyl violet representing LR control (A), LR chronic variable physical stress (B), HR control (C) and HR chronic variable physical stress (D) groups (n=6 per experimental group). Arrows are pointing at the SP-MF compartment of the mossy fibre projections. Data pertaining to estimated SP-MF terminal field volume (E) and total mossy fibre terminal field volume (F, SP-MF + IIP-MF) are expressed as means ± SEMs in bar graphs. *: p ≤ 0.05. Scale bar = 250 μm.

