
Figure 2.
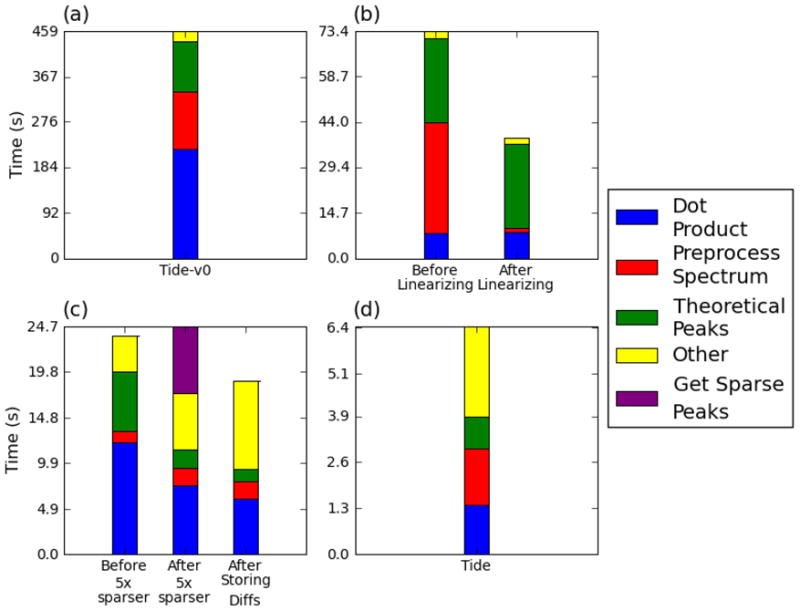
Profile of various development stages of Tide for the worm benchmark (10,000 spectra). Each profile shows how much computing time was spent in each of the major phases of Tide’s operation at various points during development. Such profiles aided in deciding how best to proceed with optimization efforts. Profiles shown are (a) Tide-v0; (b) before and after linearizing background subtraction (Supplement Section 3); (c) before and after fivefold sparser representation, and after storing d to disk (Supplement Section 7); and (d) the current version of Tide. For each plot, the (diminishing) total execution time is indicated via the y-axis scale.