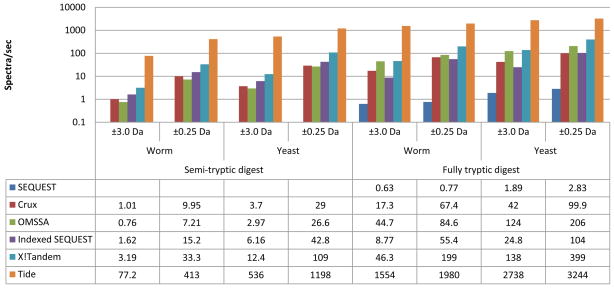
Figure 3.
Performance of Tide compared to SEQUEST, Crux, OMSSA, Indexed SEQUEST (11/2009), and X!Tandem. Performance was measured in eight settings, varying the percur-sor mass tolerance window, the digest (fully tryptic candidate peptides or semi-tryptic), and the dataset (C. elegans, “worm dataset” or S. cerevisiae, “yeast dataset”—see Methods). Bar heights in log scale show spectra processed per second, with numerical results given below. Each experiment was repeated at least 3 times with average timings shown, except for the X!Tandem experiments. Because SEQUEST runs relatively slowly, all SEQUEST experiments, as well as Crux experiments using semi-tryptic digestion, were performed with 100 randomly-selected spectra. The remaining experiments, including all Tide experiments, were performed using 10,000 benchmark spectra.

