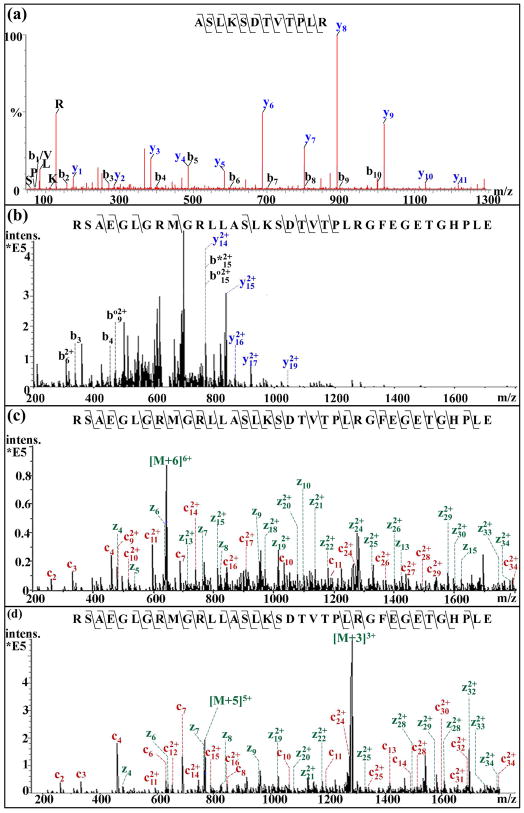
Figure 4.
A comparison of tandem MS spectra of truncated CPRP [14–25] (ASLKSDTVTPL, m/z 1287.66) by ESI-Q-TOF (a) and intact CPRP (MW 3837) by the amaZon ETD ion trap mass spectrometer for both CID and ETD fragmentation (b) MS2 of precursor ion with m/z 640 with charge state +6 by CID, * represent loss of NH3, º represent loss of H2O, (c) MS2 of precursor ion with m/z 640 with charge state +6 by ETD at (d) MS2 of precursor ion with m/z 768 with charge state +5 by ETD. For all labels in Figure 4, charge state +1 is not specified.

