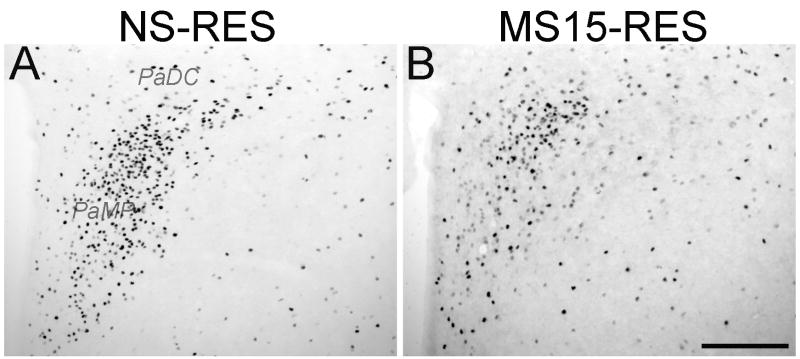
Fig. 1. Photomicrographs depicting restraint-induced Fos activation within the PVN in (A) NS and (B) MS15 cases.
MS15 rats displayed less restraint (RES)-induced Fos activation than NS rats. This difference was significant at the rostrocaudal level depicted in these photomicrographs (see Fig. 2). Scale bar (in B) = 200 μm, applies to both panels. PaDC; PVN dorsal cap: PaMP: PVN medial parvocellular.

