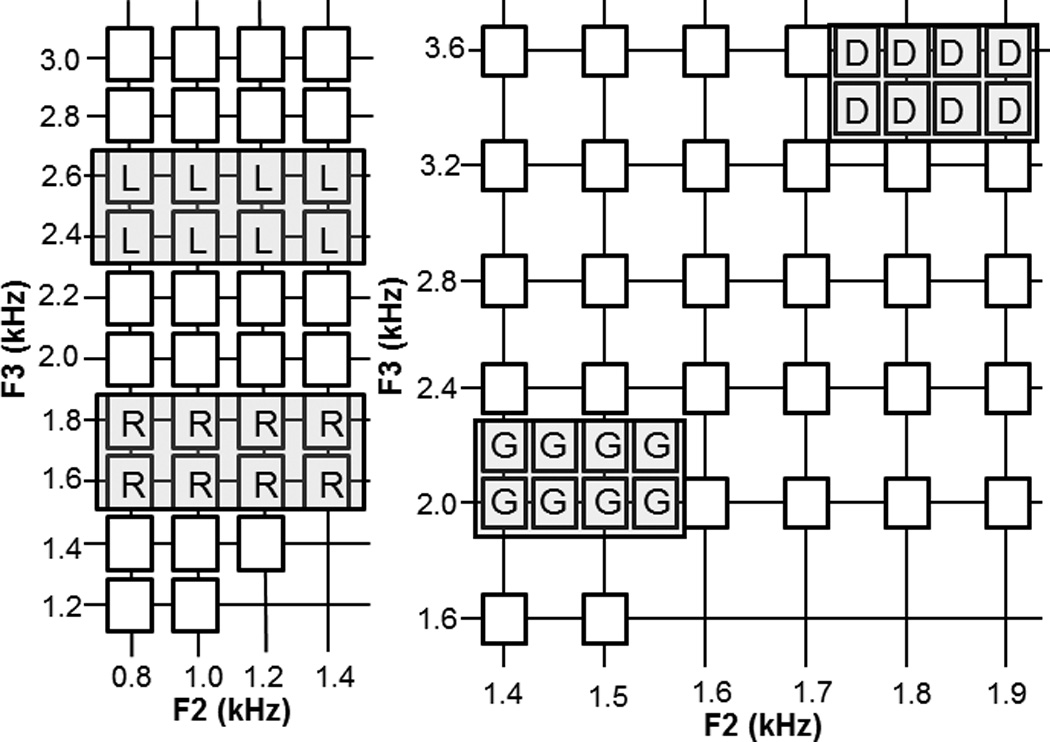
Figure 1.

Schematic diagram of training stimuli. The left panel shows the F2 and F3 onset frequency structure of /r/-/l/ stimuli whereas the right panel plots /d/-/g/ stimuli. All stimuli on the grids were used during perceptual cue weighting tasks. The stimuli highlighted with shaded rectangles were used during the training and categorization testing. Additional interleaved stimuli within the shaded region (not pictured) served as generalization stimuli.
