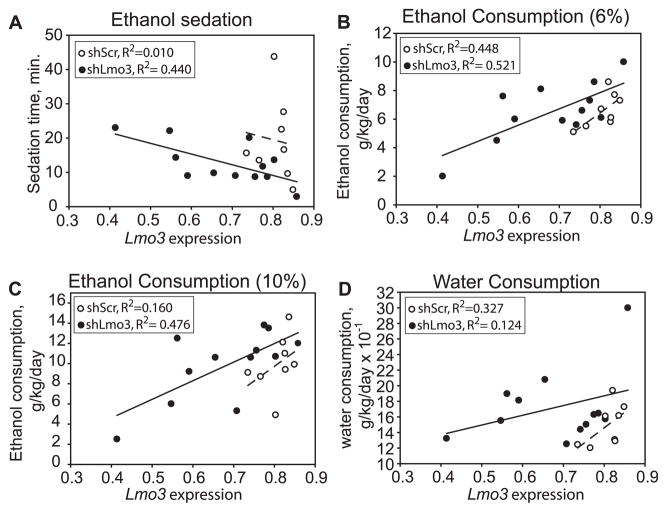
Fig. 4.
Correlations between Lmo3 expression and behavioral responses to ethanol in transgenic shLmo3.8 and shScr mice. In all graphs, normalized Lmo3 expression is plotted on the x-axis and the behavioral response on the y-axis. Mice expressing shLmo3.8 (n = 12) are represented by closed circles and shScr (n = 8) by open circles. (A) Negative correlation between Lmo3 expression and ethanol sedation in the loss-of-righting-reflex test with a 3.2 g/kg dose of ethanol. (B, C) Positive correlation between Lmo3 expression and 2-bottle choice ethanol consumption of 6% (B) and 10% (C) ethanol. (D) Water consumption and Lmo3 expression were not significantly correlated.

