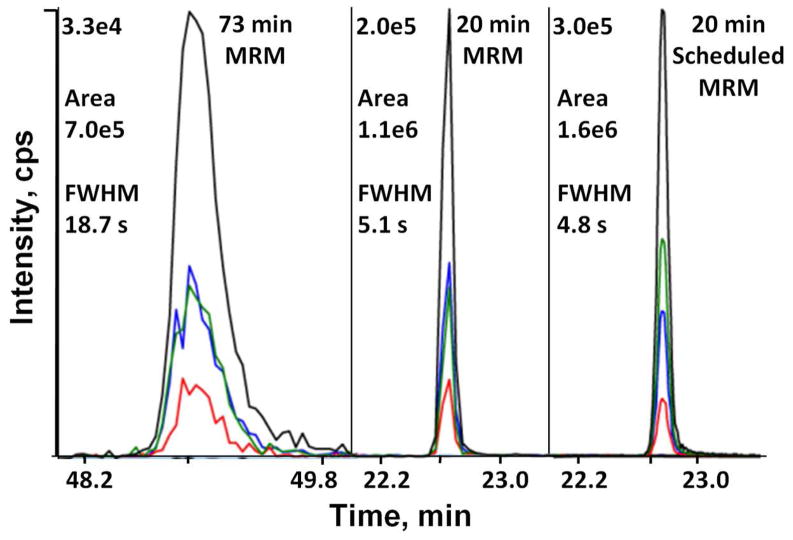
Figure 2.
Comparison of UPLC gradients for LC-MRM assays. XIC of MRM transitions for the enolase peptide YDLDFK from the 73 and 20 min gradients, and a 20 min gradient with scheduled MRM enabled. For scheduled MRM, the detection window was set at 2 min, and target scan time was 1 s. The intensities, areas, and peak widths of the most intense y5 transition (400.69/637.32, black line) are indicated. Other transitions are y4 (400.69/522.29, green line), y3 (400.69/409.21, blue line), and b4 (400.69/507.21, red line). The time axes are shown using the same scale.

