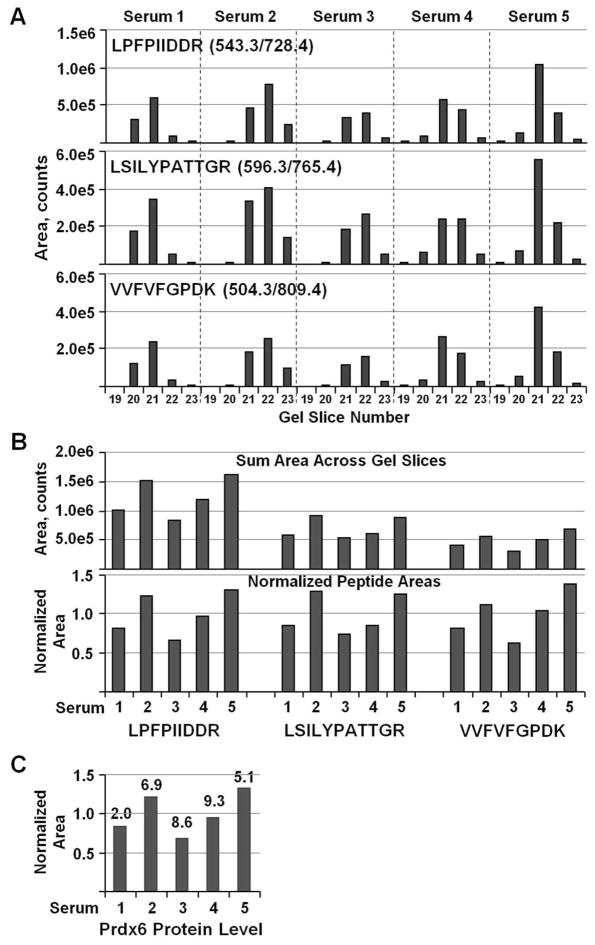
Figure 3.
GeLC-MRM quantitation profiles of Prdx6 across gel slices. (A) MRM quantitation of three Prdx6 peptides in tryptic digests of gel slices #19 to 23 (24–40 kDa region) from five depleted serum samples. The peptide sequences together with the MRM transition used for quantitation are indicated. (B) The amount of peptide in each serum sample was determined by summing the signal of the strongest transition across all gel slices. The bottom chart shows peptide amounts after normalizing against the average value for each peptide. (C) The relative Prdx6 protein level in each sample calculated from the average of the normalized peptide values. The %CV was determined from the three normalized peptide values and is indicated on the top of each bar.

