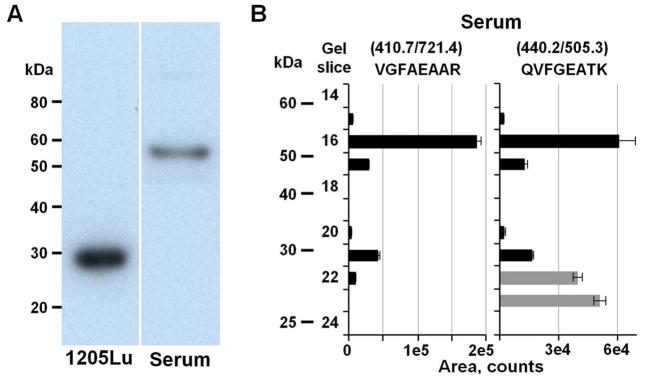
Figure 4.
Detection and quantitation of different forms of CTSD. (A) Western blot of CTSD in a melanoma 1205LU cell extract and major protein depleted human serum using C0715 monoclonal anti-cathepsin D antibody. (B) GeLC-MRM quantitation of CTSD in the major protein depleted human serum. MRM assays were run on the 20–70 kDa region of the gels. The CTSD peptide sequences and the MRM transitions are indicated at the top of the panel. Grey bars represent quantitation values from a co-eluting interference with similar ratios for two of the three monitored MRM transitions as the targeted peptide (see Supplemental Figure 2). Error bars indicate standard deviations from duplicate injections.

