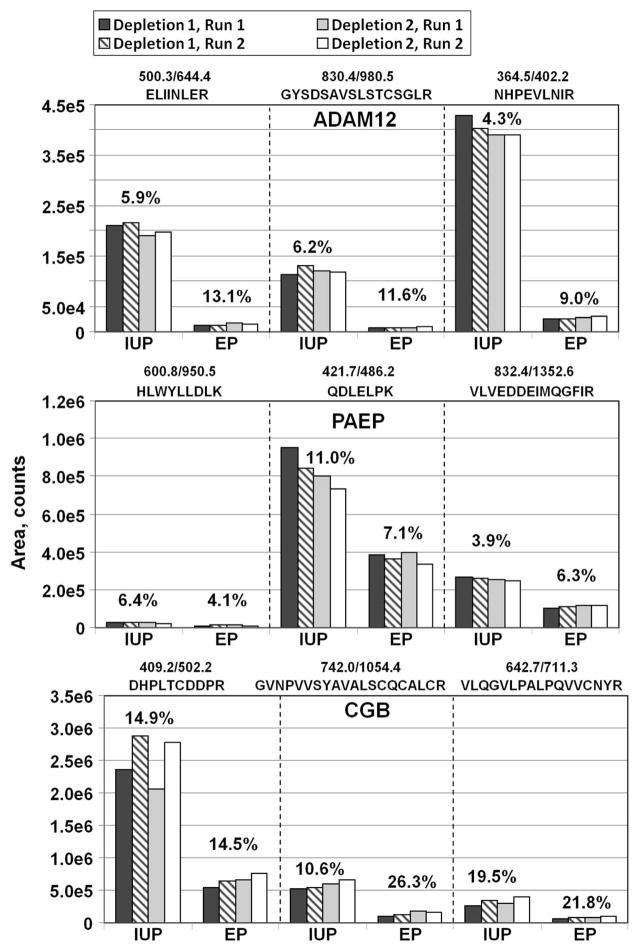
Figure 5.
Reproducibility of the label-free MRM analysis using major protein depletion and 1-D SDS fractionation. MRM data for ADAM12, PAEP, and CGB are shown. Three peptides for each protein were quantitated. Depletions 1 and 2 are replicate Top-20 depletions of EP and IUP serum samples performed on different days. Run 1 and Run 2 are duplicate injections of tryptic digests onto a 4000 QTRAP mass spectrometer. Bars indicate areas of the strongest MRM transition for each peptide, summed for gel slices 12–15. The % CV of all replicate runs is indicated above each sample.

