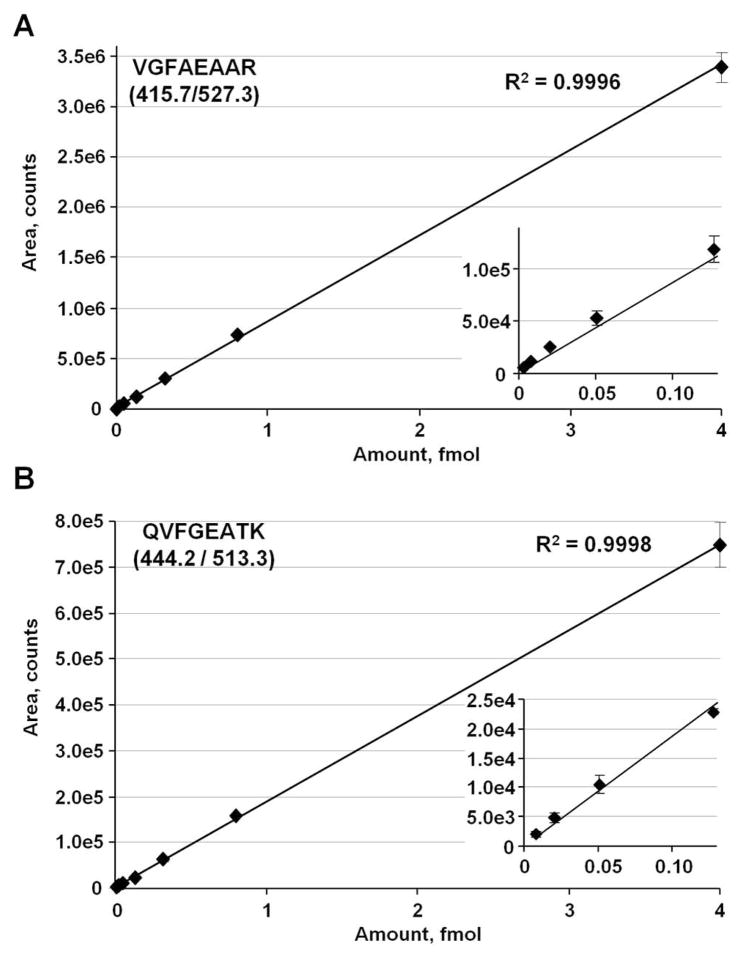
Figure 8.
GeLC-MRM quantitation of two, heavy, isotope-labeled CTSD peptides using a 5500 QTRAP mass spectrometer. Heavy peptides were spiked at 3, 8, 20, 51, 128, 320, 800, and 4000 amol into a tryptic digest of a fraction of depleted human serum after 1-D gel separation. (A) Standard curve of transition 415.7/527.3 for the (13C6 15N4) VGFAEAAR peptide. (B) Standard curve of transition 444.2/513.3 for the (13C6 15N2) QVFGEATK peptide. Inserts, expanded views of the lower regions of the standard curves. Error bars are standard deviations from duplicate injections. The most intense transition of each peptide was used in the standard curve plots. XICs for the peptides are shown in Supplemental Figure 3.

