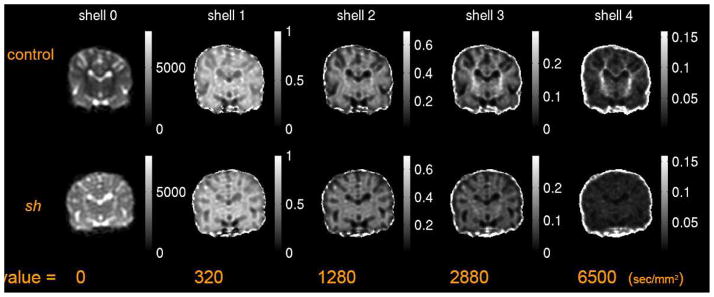
Figure 1.
Geometric means of diffusion-weighted signals at different b-values of HYDI shells of a pair of 3 months old littermate control and sh pup. The gray scale at b-value = 0 sec/mm2 denotes the signal intensity, whereas the gray scale of images with b-value > 0 denotes the ratio of signal intensities to that of b-value = 0 sec/mm2.

