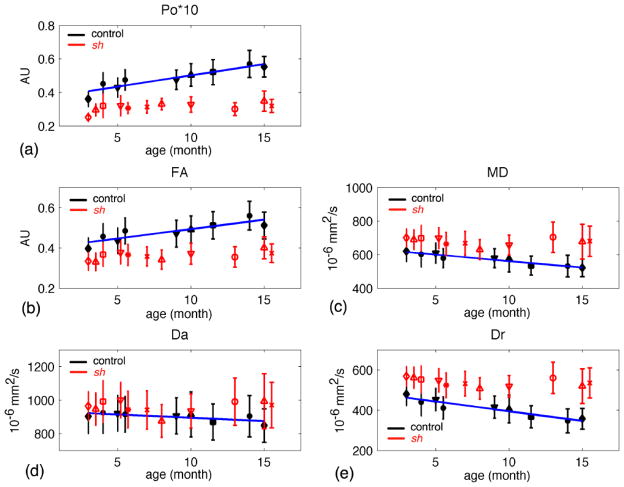
Figure 4.
Diffusion measures in the whole brain white matter (WBWM) vs. age for the control (in black symbols) and sh pups (in red symbols). (a) Po, the zero displacement probability; (b) FA, fractional anisotropy; (c) MD, mean diffusivity; (d) Da, axial diffusivity; (e) Dr, radial diffusivity. Only control pups had significant fits (p-value < 0.05), where the regression lines were plotted in dark blue. Each symbol denotes an individual pup.

