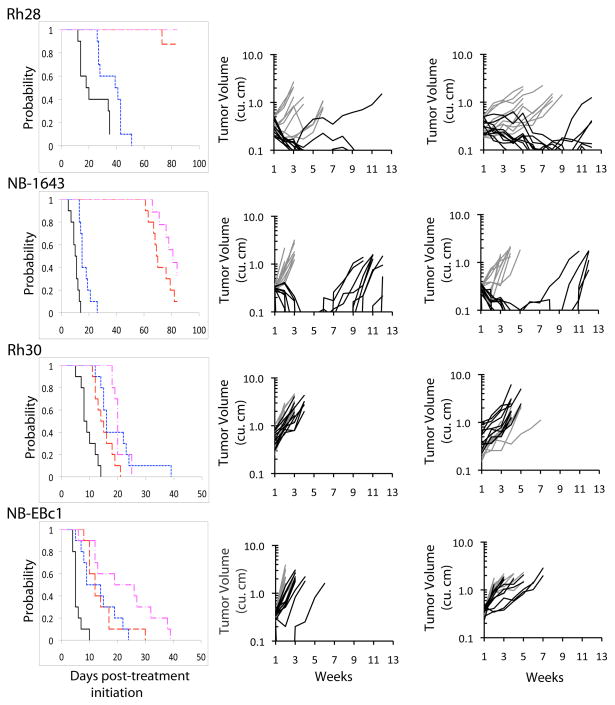
Figure 2.
Responses of sarcoma and neuroblastoma xenografts to IMC-A12 and rapamycin administered as single agents or in combination. Tumor-bearing mice were treated with IMC-A12 by IP administration at a dose of 1 mg per mouse administered twice weekly, and rapamycin by intraperitoneal (IP) administration at 5 mg/kg daily × 5 repeated weekly for a planned four consecutive weeks.
Left panels: Kaplan-Meier Event-Free Survival estimates for control and treated groups. Control (____); IMC-A12 (
 ); Rapamycin (
 ); IMC-A12 + rapamycin (
 ). Center panels: Individual tumor growth curves. Controls (gray), IMC-A12 treated (black). Right panels: Individual tumor growth curves. Rapamycin (gray), IMC-A12 + rapamycin (black).

