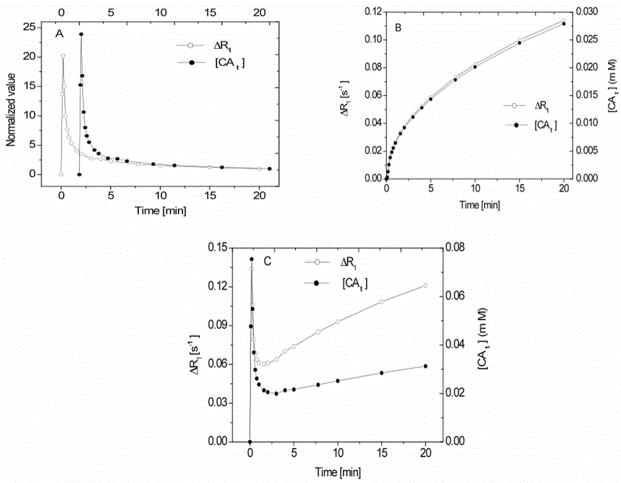
Figure 5.
5A: Concentration-time plot of the change in the relaxation rate of tissue water protons (ΔR1; open circles) and tissue CA concentration (filled circles) for the case of all of the CA in blood. ub = 0.02. 5B: Concentration-time plot of ΔR1 (open circles) and tissue CA concentration (filled circles) for an entirely extracellular CA; this was modeled with Equation [22], Ktrans = 4.0 × 10⁻³ min−1 and ub = 0.02. 5C: Concentration-time plot of ΔR1 (open circles) and tissue CA concentration (filled circles) for the combined plots of 3A and 3B. The other model parameters values are listed in the Table 1. In 5C, the effect of the different apparent relaxivities of CA between blood and interstitium should be noted. While the component ΔR1’s track very closely with tissue concentration in their respective compartments, the combination does not.

