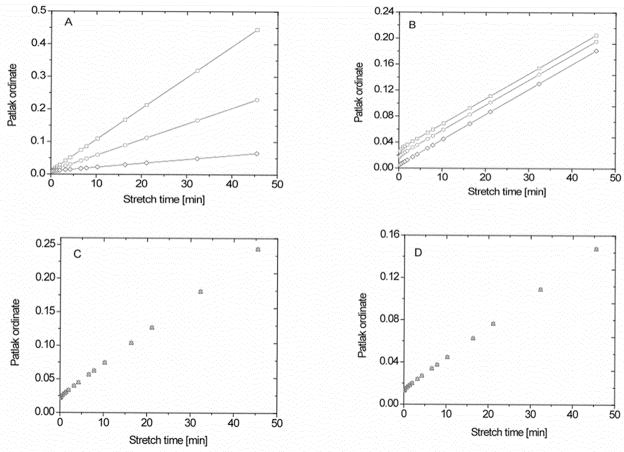
Figure 6.
Families of the plots obtained with the multi-time, graphical method of Patlak in a 3S2X model with the ordinate equal to and the abscissa equal to the efflux-corrected term , which is often referred to as ‘stretch time’ when the CA is injected as a bolus. 6A: With Ktrans = 0.01, 0.005, and 0.00125 min−1; top to bottom) and ub = 0.02. 6B: With blood water fractions, ub, set as 0.06, 0.04, and 0.01 (top to bottom) and Ktrans = 4 × 10⁻³ min−1. 6C: With the transendothelial rate of influx, kbe, varied from 10 to 2 to 0.5 s−1(top to bottom), Ktrans = 5 × 10⁻³ min−1, and ub = 0.05. 6D: Rate of exchange across parenchymal cell membrane set at either 10, 2, or 0.5 s−1 (top to bottom), Ktrans = 3 × 10⁻³ min−1, and ub = 0.03. The other parameters of this modeling are listed in Table 1.

