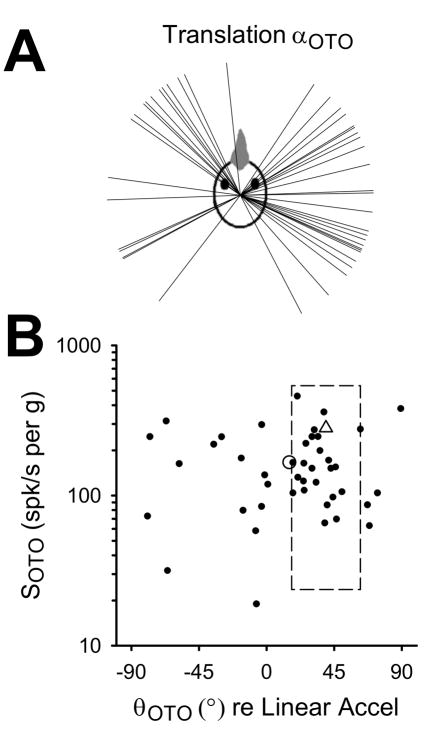
FIGURE 3.
Responses of convergent neurons (n=43) to earth-horizontal linear translation (0.5Hz, 0.2g). A: Axes of maximum sensitivity (αOTO) are plotted as unit vectors in two-dimensional head space. B: Maximum sensitivity (SOTO) and phase (θOTO) values are expressed relative to linear acceleration, with the population mean indicated by the open circle. The mean pigeon otolith afferent sensitivity and phase is indicated by the open triangle, and the box indicates the corresponding standard deviation (Si, Angelaki and Dickman 1997).

