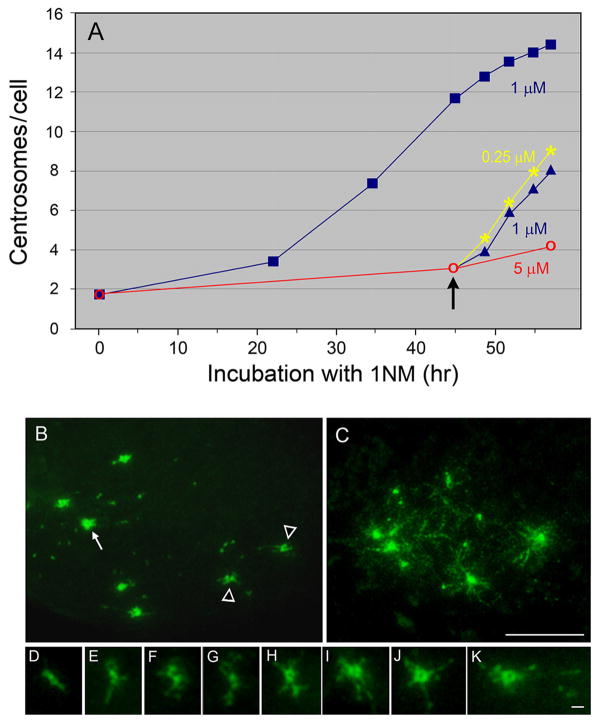
Figure 7.
Acceleration of centrosome assembly in cdk1as/cdk2−/− cells during recovery from G1 arrest. A: The average numbers of centrosomes induced in cdk1as/cdk2−/− cells treated with different concentrations of PP1. After 45 hr of culture in a medium containing 5 μM PP1 (red), cells were shifted to either 0.25 (yellow) or 1 μM PP1 (blue triangles) (arrow). During an additional ~12 hr culture, these cells induced more centrosomes than cells cultured continuously with 1 and 5 μM PP1 (blue squares). B–K: Immunofluorescence staining of cdk1as/cdk2−/− cells undergoing rapid centrosome assembly. γ-Tubulin staining reveals the presence of numerous small spots scattered throughout the cytoplasm (B). A ring-like centriole/centrosome (arrow, corresponding to H–K at a high magnification) and precursor-like centrosomal structures (arrowheads, corresponding to D–G at a higher magnification) are seen. In C–K, thin fiber-like amorphous materials associate with the centrosomes (C, H to K) and precursor-like structures (D–G). Bars, 10 μm (B–C) and 1μm (D–K).

