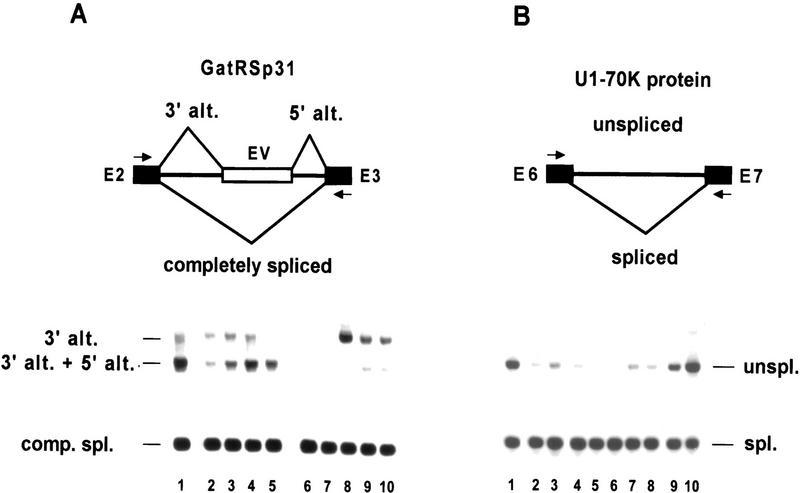
Figure 8.
Regulation of the alternative splicing pattern of atRSp31 and U1–70K in plants overexpressing atSRp30. The relevant alternative splicing events are shown in the diagrams at the top. RT–PCR was carried out using primers (marked with arrows) derived from the adjacent exons. (A) Changes in splicing in the second intron of GatRSp31. (Lane 1) Control line transformed with pBI121 (35SCaMV–GUS construct), (lanes 2–5) lines transformed with the pG30 construct; (lanes 6–10) lines transformed with pC30. (B) More correctly spliced mRNA encoding U1–70K protein is produced upon overexpression of atSRp30. (Lane 1) control plant transformed with pBI121 (35SCaMV–GUS construct); (lanes 2,3) lines transformed with the pG30 construct; (lanes 4–8) plants transformed with pC30; (lane 9) control pC30 transgenic plant that does not overexpress mRNA1; (lane 10) 19-day-old wild-type plant.

