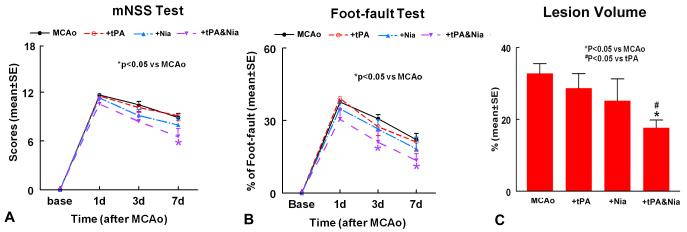
Figure 1. Neurological outcome and lesion volume measurements after stroke.
Panels A-B show mNSS (A) and foot-fault (B) tests after stroke in the 4 experimental groups (MCAo control, tPA-10mg/kg, Niaspan-20mg/kg, and Combination treatment tPA and Niaspan treatment groups). Panel C shows the lesion volume in the 4 experimental groups. SE = standard error. *p< 0.05 vs MCAo.

