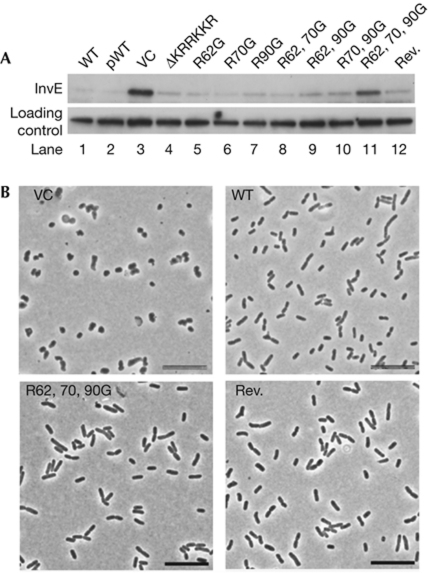
Figure 5.
Functional domain mapping. (A) Immunoblot analysis of InvE protein at 30 °C in MS5201 (ΔrodZ) strains carrying the indicated expression plasmids. Lanes: 1, WT MS390; 2, ΔrodZ strain carrying pBAD-rodZ; 3, VC; 4, ΔKRRKKR; 5, R62G; 6, R70G; 7, R90G; 8, R62G, R70G; 9, R62G, R90G; 10, R70G, R90G; 11, R62G, R70G, R90G; 12, R62G, R70G, R90G with KRRKKR (Rev.). (B) Phase contrast images of strain MS5201 (ΔrodZ) expressing the indicated RodZ variants. Scale bars, 10 μm. Rev., reversion of the short basic region; VC, vector control; WT, wild type.

