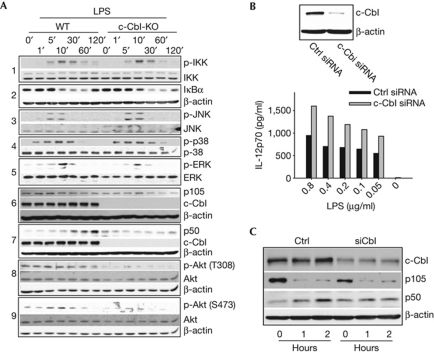
Figure 3.
c-Cbl deficiency reduces both p105 and p50 levels in BMDCs. (A) WT or Cbl-KO BMDCs were stimulated with LPS (1 μg/ml) and lysed at the indicated time points before western blot analysis. All inputs were normalized on the basis of protein assay results. (B) Upper panel: BMDCs were nucleofected with scrambled (Ctrl) or c-Cbl siRNA, and the amount of endogenous c-Cbl expression was quantified by western blot analysis. Control or Cbl-KD BMDCs were stimulated with the titrated amounts of LPS 8–10 h after nucleofection, and the supernatants were collected after overnight stimulation for IL12p70 quantification by ELISA (lower panel). (C) Control or Cbl-KD BMDCs were stimulated with LPS at the indicated time points before preparation for western blot analysis. Data are representative of at least three independent experiments with consistent results. Cbl-KO, c-Cbl-knockout; ELISA, enzyme-linked immunosorbent assay; ERK, extracellular signal-regulated kinase; IκB, inhibitor of κB protein; IL, interleukin; JNK, Jun N-terminal kinase; KD, knockdown; LPS, lipopolysaccharide; siRNA, small-interfering RNA; WT, wild type.

