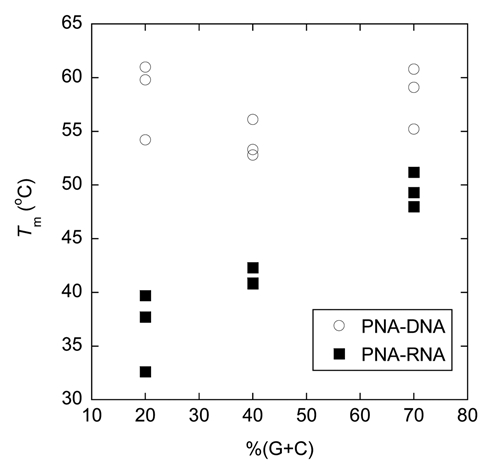
Figure 5.

A plot showing relationship between G+C content and thermal stability of acpcPNA·DNA and acpcPNA·RNA hybrids. Conditions: 1.0 µM acpcPNA, 1.0 µM DNA, 10 mM sodium phosphate buffer pH 7.0, 100 mM NaCl, heating rate 1.0°C/min. Tm values are accurate to within ±0.5°C.
