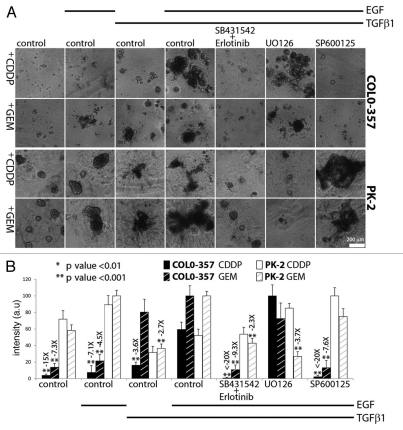
Figure 5.
Protective effects of EGF/TGFβ1 against cytotoxic compounds. Cells were seeded in 3% Matrigel™/soft agar and treated after 4 days with cytotoxic compounds (CDDP or GEM; column 1) alone or in combination with indicated GF and kinase inhibitorss at a final concentration of 100 pM TGFβ1, 1 nM EGF, 10 µM CDDP, 10 nM GEM, 20 µM SB431542, 2 µM erlotinib, 10 µM UO126 and 10 µM SP600125. (A) Representative images of epithelial structures were captured 4 days after treatment. Scale bars indicate image magnification. (B) Cells were stained with MMT after 8 days of treatment. Colorimetric intensity of MTT signal was quantified; average intensity value and standard deviation are displayed for each sample (n = 6) of this representative experiment. Relative fold change (over −2X) and statistical significance of this change with respect to EGF/TGFβ1-treated with CDDP or GEM (column 3) samples are displayed on top of the sd bars.

