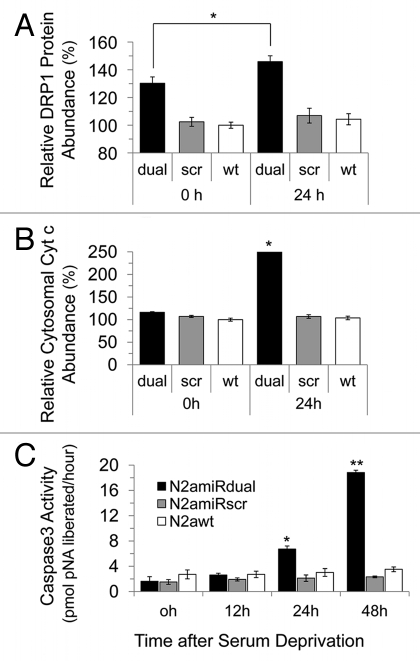
Figure 5.
Apoptotic resistance to serum deprivation. Cells were cultured under conditions of serum deprivation and collected at indicated time points. (A) Detection of Drp1 expression levels analyzed by densitometric analysis of western blot. (B) Cytochrome C expression in cytosolic fractions detected by immunoassay. (C) Analysis of caspase 3 activity calculated by comparison with the free pNA. dual, N2amiRdual; scr, N2amiRscr; wt, miR non-treated wild-type N2a (*p < 0.05, **p < 0.01).

