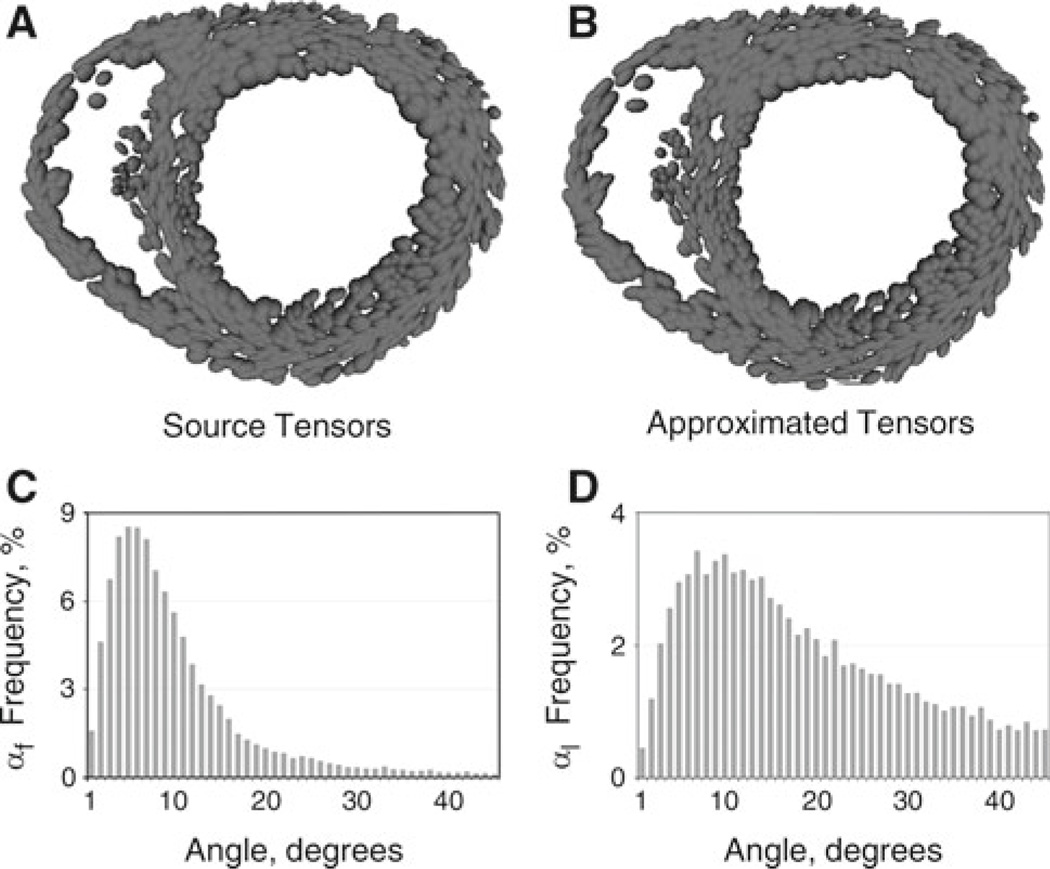
Fig. 4.
Tensor interpolation and comparison with the original DTMR imaging data for the normal canine ventricles. Tensors from DTMR images (a) and approximated tensors (b) are represented as ellipses, where the lengths of each axis correspond to the DT eigenvalues. Frequency distribution bar graphs of the angles αf (c) and αl (d)

