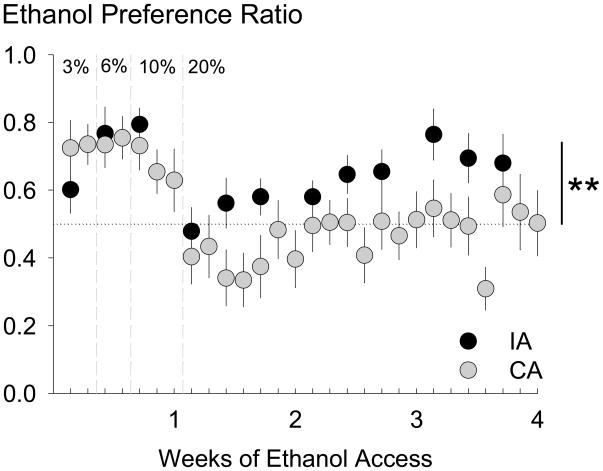
Fig. 2.
Preference ratios were calculated for male C57BL/6J mice by dividing the amount of ethanol solution consumed by the total volume of fluid consumed over 24 hours on alcohol-drinking days. Mice given intermittent access (IA, black circles, n = 15) had a significantly higher preference for 20% ethanol than mice given continuous access (CA, gray circles, n = 12). Data are mean ethanol preference ± SEM. ** p < 0.01 difference between groups.

