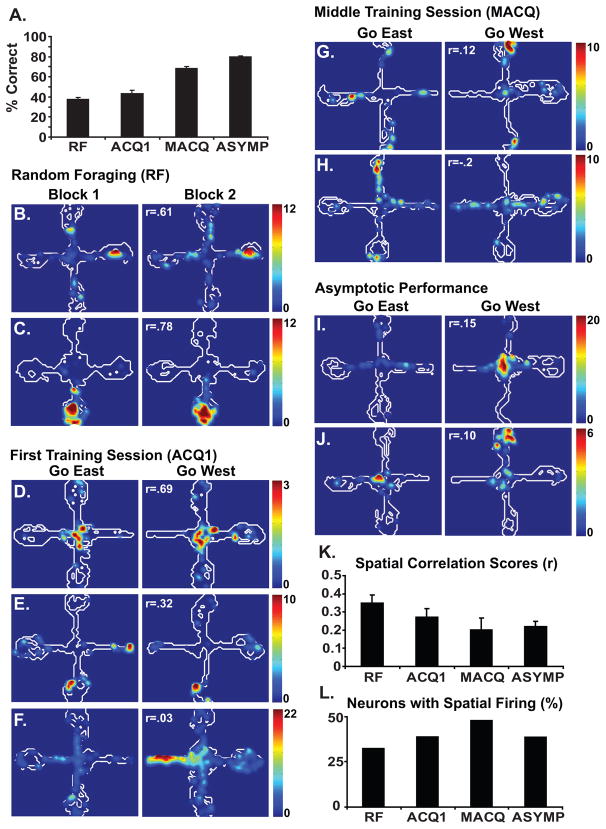
Fig. 1.
Behavioral data are shown in A. The average percentage of trials in which the rats made a correct arm entry (with no erroneous entries into non-rewarded arms) are shown for the random foraging (RF) session, the first training session (ACQ1), the session half way through training (MACQ) and asymptotic performance (ASYMP). The contour plots (B–J) show examples of the spatial firing patterns of individual hippocampal neurons recorded during each of stage of training. The regions of the maze visited by the rat are outlined in white. The firing rates are illustrated by the colored contour peaks, with the scale (in Hz) indicated for each neuron. Each pair of plots shows the data of a single neuron during a single session. Spatial correlation scores (r) indicating the similarity of the spatial firing patterns are given for each pair of plots. Plots B and C illustrate the firing patterns of two neurons recorded during the first and second halves of the random foraging session (Block 1 and Block 2). For each trial, rewards were placed at the end of randomly designated arms and the rat started on one of the three non-rewarded arms. Plots D–F illustrate the firing patterns of neurons recorded during the first training session. Each pair of plots illustrates neuronal firing during the first half of the session (Go East) when the reward was always placed on the east arm, and during the second half (Go West) when the reward was always placed on the west arm. Similarly, plots G–H and plots I–J illustrate the firing patterns of neurons recorded during the middle acquisition session and during asymptotic performance, respectively. Prior to training, the neuronal firing patterns were highly similar across the two blocks of training (e.g. B and C). Early in training, the firing patterns of some neurons were similar in the two contexts (e.g. D) while others were more distinct in the two contexts (e.g. F). As learning progressed, the firing patterns of the neurons became more distinct (e.g. G–J). This can be seen in the bar plots, which summarize the spatial firing of the hippocampal neuronal population during each stage of training. The average spatial correlation scores declined as the rats learned to discriminate the two contexts (K). The percentage of neurons that exhibited a place field did not change with training (L). Plots B, I and J were adapted from Smith and Mizumori, 2006b.

