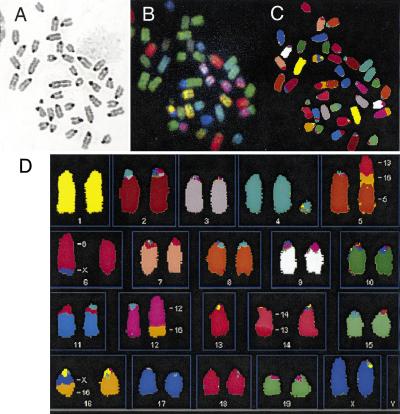
Figure 2.
SKY showing analysis of spontaneous chromosome abnormalities in Brca2Tr/Tr cells. (A) Shows a DAPI-banded image of a typical metaphase, after hybridization with fluorescent probes in B, and in display colors by assignation of hybridization signals to specific spectral ranges (C,D). (D) Shows multiple abnormalities representing GCRs (see text)

