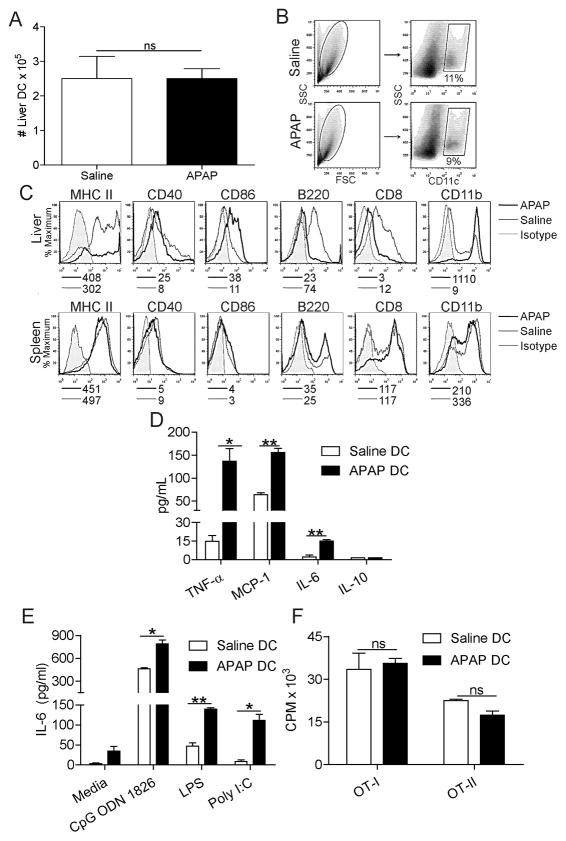
Figure 3. DC immune-phenotype is altered after APAP challenge.
(a) The total number and (b) fraction of CD11c+ liver NPC per mouse was determined by flow cytometry. (c) Liver or spleen DC expression of surface markers in APAP or saline treated mice were measured. Median fluorescence indices are listed below histograms. (d) Liver DC production of IL-6, TNF-α, MCP-1, and IL-10 in cell culture supernatant was measured. (e) Liver DC production from IL-6 was also measured after incubation with ligands for TLR9 (CpG ODN 1826), TLR3 (Poly I:C), and TLR4 (LPS). (f) DC induction of antigen-restricted T cell proliferation was measured using appropriate peptide pulsed DC to stimulate CD4+OT-II and CD8+OT-I T cells. All in vitro experiments performed in triplicate and repeated at least three times (*p<0.05; **p<0.01).

