Fig. 3.

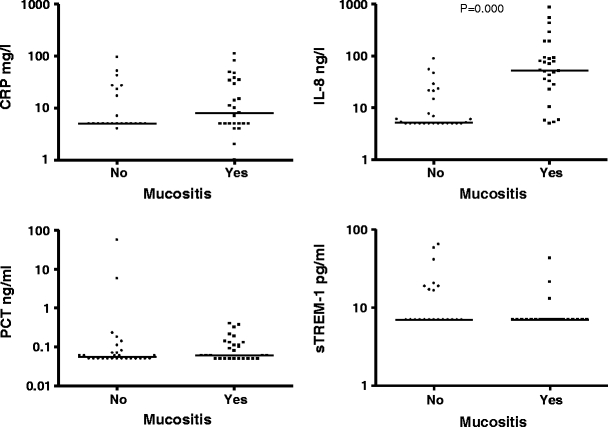
CRP, IL-8, PCT, and sTREM-1 in the presence and in the absence of mucositis. The horizontal lines represent the median. The markers are shown by log 10 at the y-axis, because of the widespread values

CRP, IL-8, PCT, and sTREM-1 in the presence and in the absence of mucositis. The horizontal lines represent the median. The markers are shown by log 10 at the y-axis, because of the widespread values