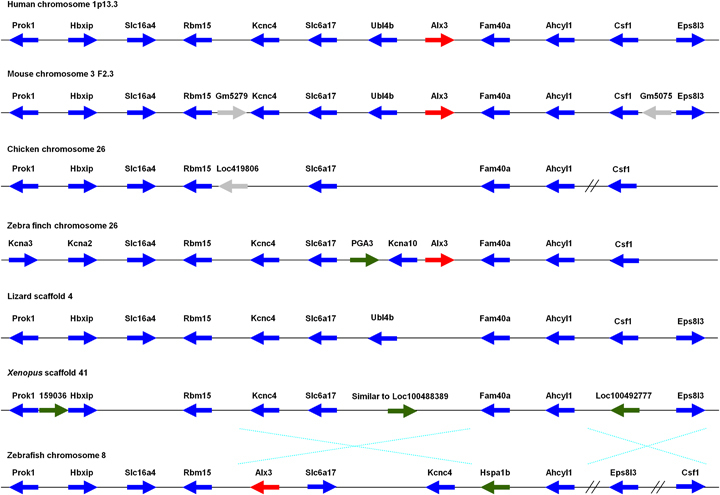
Fig. 2.

Schematic diagram showing the location of Alx3 and neighboring genes in syntenic regions of Homo sapiens, Mus musculus, Gallus gallus, Taeniopygia guttata, Anolis carolinensis, Xenopus tropicalis, and Danio rerio. Arrows indicate genes and their direction of transcription. The blue/black arrows represent loci for which syntenic conservation is confidently identified (zebra finch Kcna genes are denoted by blue arrows because their orthologs in other vertebrates are located immediately downstream of Prok1). Alx3 genes are highlighted with red arrows/gray shadows. The green/gray arrows denote loci for which orthologs are not located in the syntenic region; these are probably inserted secondarily. The gray arrows denote predicted pseudogenes. The dotted crosses indicate inversions within this region in zebrafish genome. The double oblique lines in the zebrafish and chicken genomic regions indicate presence of other genes between the loci shown.
