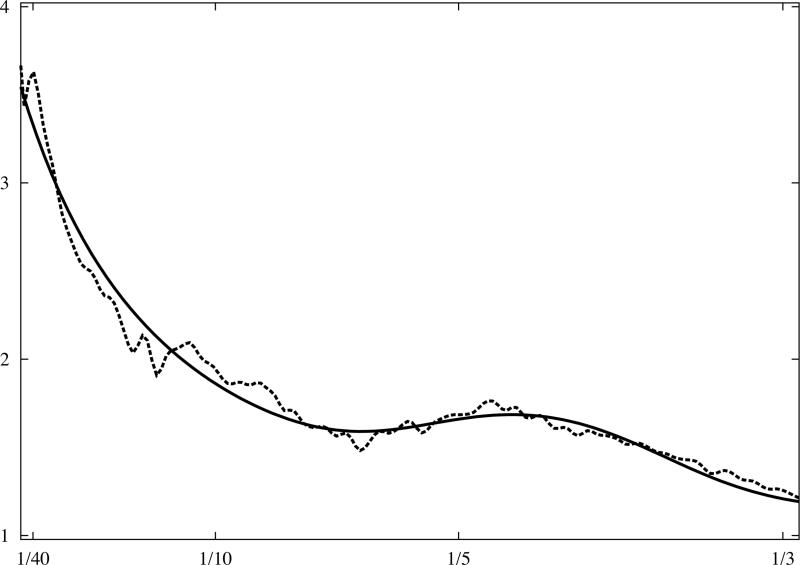
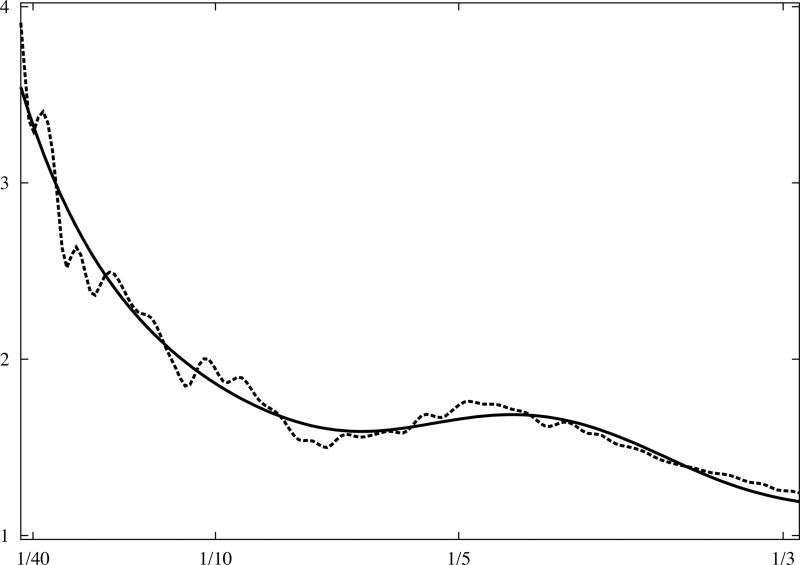
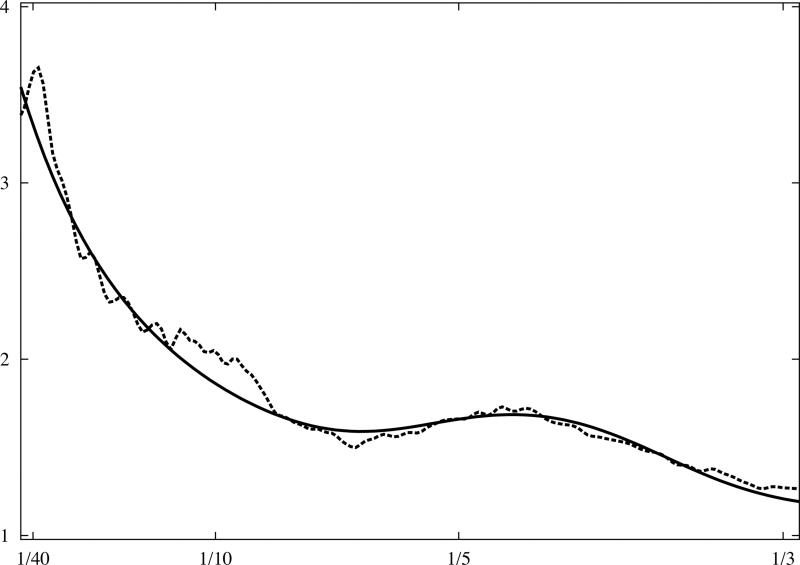
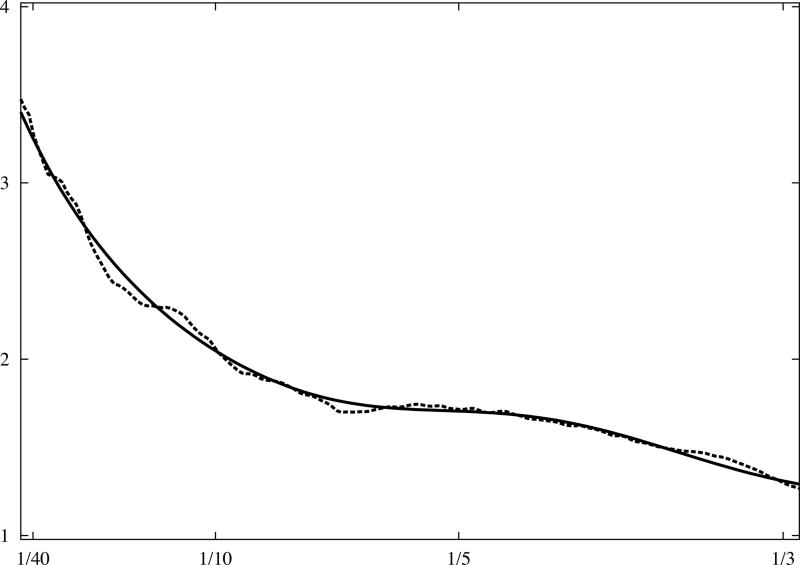
Fig.3.
Analytical model of 1D rotationally averaged power spectrum of macromolecular complexes. X-ray crystallographic atomic models were converted to discrete 3D electron density maps using tri-linear interpolation and voxel size 1.0Å. Eq.16 was fitted to rotationally averaged 3D power spectra of all maps. The vertical axis is in arbitrary units, and the horizontal axis corresponds to modulus of spatial frequency [1/Å]. (a) 20S proteasome, 630kDa (PDB:1J2Q), (b) GroEL chaperonin, 715kDa (PDB:1KP8), (c) calmodulin-dependent protein kinase II (CaMKII), 205kDa (PDB:1HKX), (d) 70S ribosome, ~2,000kDa (PDB:2AVY). Power spectra of complexes (a-c) were modelled using the same parameters as in Eq.16 while the power spectrum of ribosome (d) required minor adjustments.


