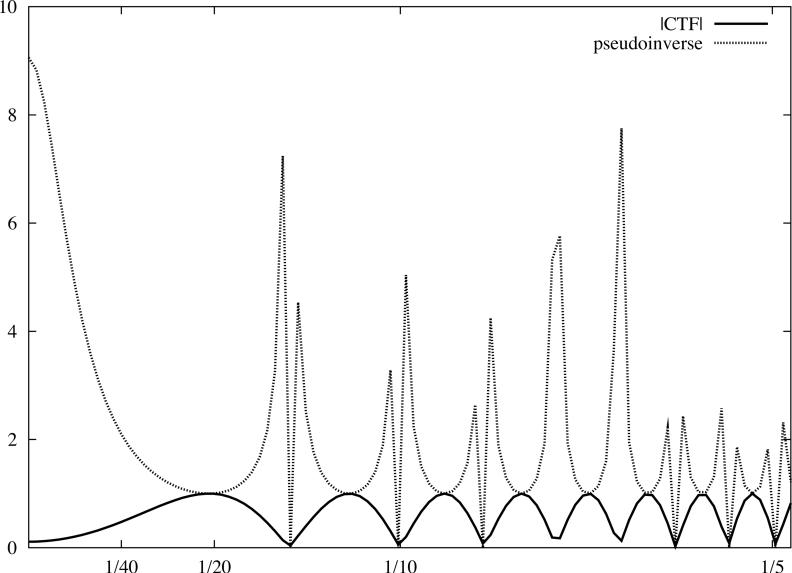
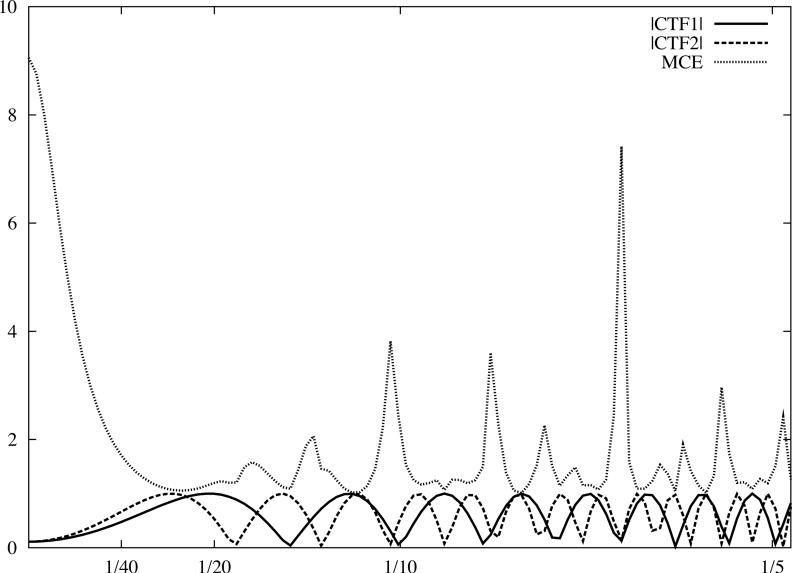
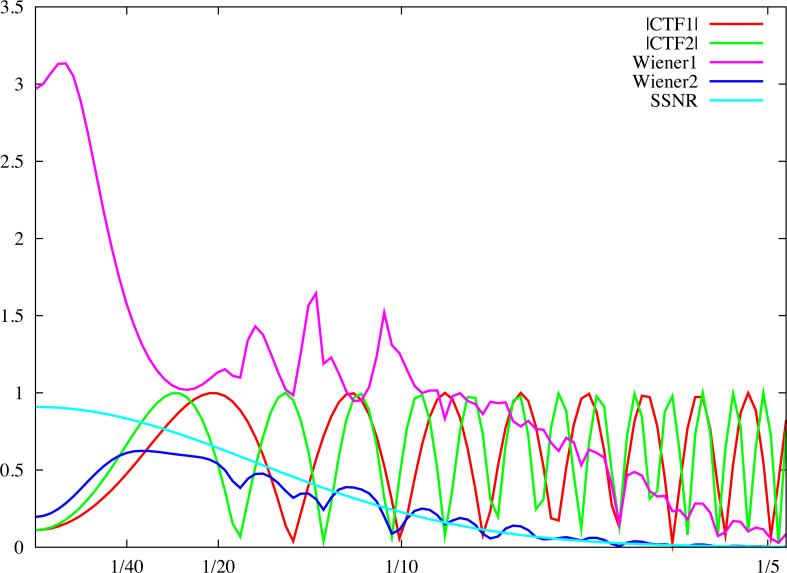
Fig.4.
Linear cryo-EM image restoration filters. The horizontal axis corresponds to modulus of spatial frequency [1/Å]. (a) CTF (accelerating voltage 300kV, amplitude contrast 10%, defocus 1.0μm) and the pseudoinverse filter (Eq.19) with ε = 0.02. (b) Two CTFs, first as in (a), the second with defocus 1.6μm, and the Mean Square Error filter (Eq.26) with the variance of data omitted. (c) Wiener filters (Eq.42) plotted assuming the SSNR is the same for each CTF and is given by a Gaussian function. For the first filter (magenta), the maximum SSNR is set to 20 while for the second filter (blue), it is set to 0.9. Note that identical filters can be obtained using the CMCE filter (Eq.31) with regularisation function U set to the inverse of the SSNR of the data. For clarity, we plotted moduli of the CTF function.


