
Figure 2.
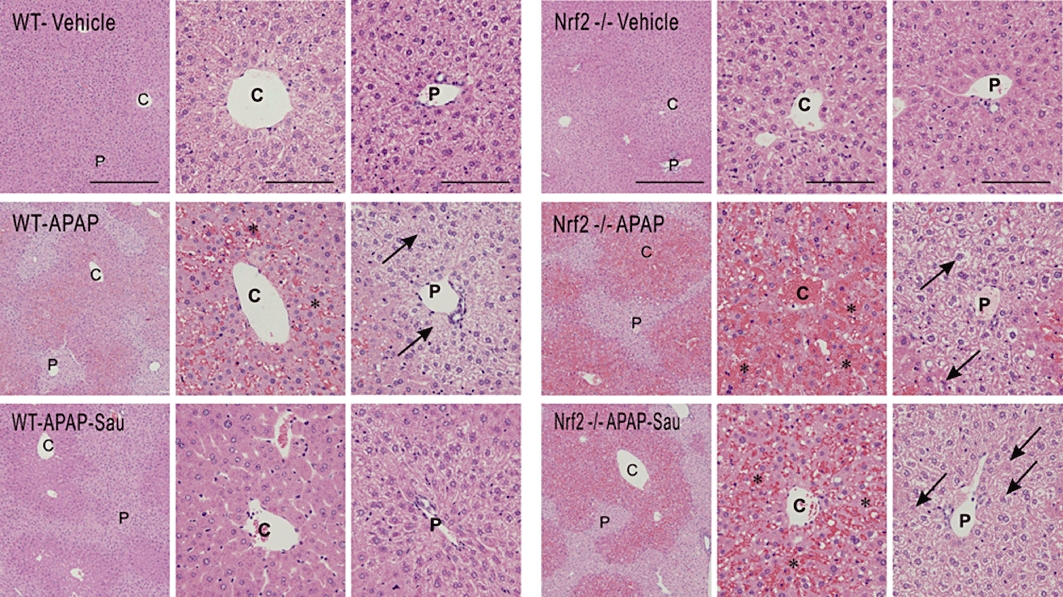
Haematoxylin and eosin staining of the liver. Mice were treated with acetaminophen (APAP) or APAP + sauchinone (Sau), as described in the legend to Figure 1 (n = 6 each). Arrows indicate degeneration and necrosis of the hepatocytes. C, central vein; P, portal space; *, haemorrhage; scale bars = 200 µm in left column and 50 µm in middle and right columns; Low-power view (left column) and high-power view of the central and portal area (right column). Nrf2, nuclear factor erythroid-2-related factor-2; WT, wild-type.