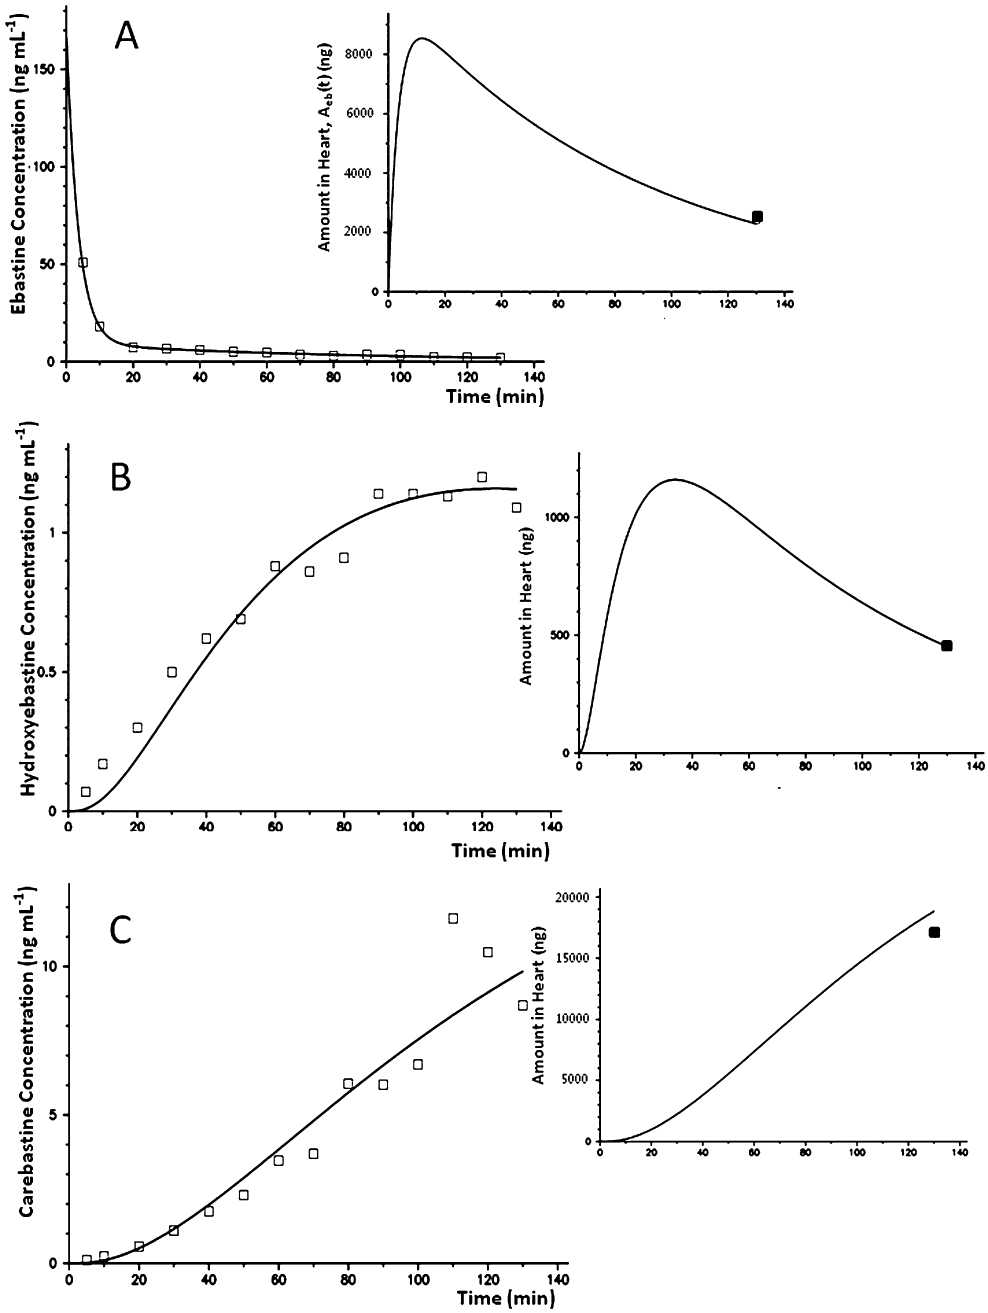
Figure 3.

Model fit of the reservoir concentration of ebastine (A), hydroxyebastine (B) and carebastine (C) in one heart. The inserts show the time courses of amount in the heart as predicted by the model to fit the amount measured at the end of perfusion.
