
Figure 8.
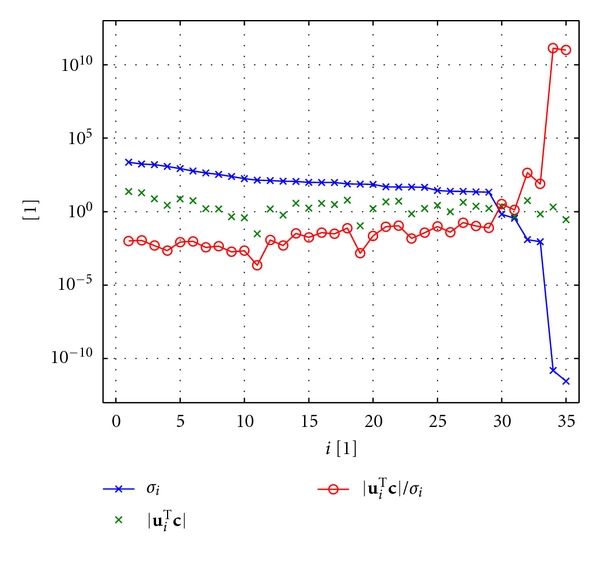
SVD analysis of the matrix A constructed from the example data shown in Figure 6. The plot displays the absolute values of the weighting factors (u i T c)/σ i and of their individual components |u i T c| and σ i on a logarithmic scale.
Official websites use .gov
A
.gov website belongs to an official
government organization in the United States.
Secure .gov websites use HTTPS
A lock (
) or https:// means you've safely
connected to the .gov website. Share sensitive
information only on official, secure websites.
SVD analysis of the matrix A constructed from the example data shown in Figure 6. The plot displays the absolute values of the weighting factors (u i T c)/σ i and of their individual components |u i T c| and σ i on a logarithmic scale.