
Figure 3.
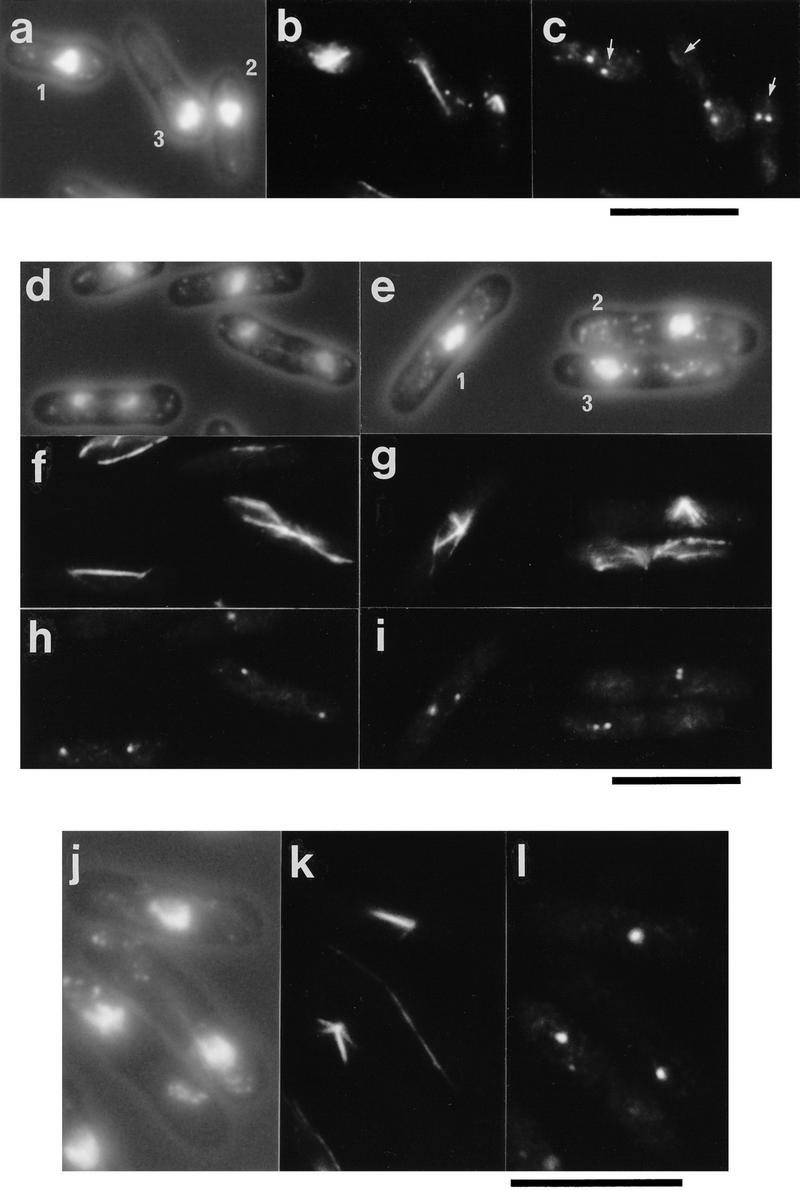
Defective spindle formation in cells deleted for the cut12+ gene and cells overexpressing cut12+. (a–c) Defective spindle formation and cut divisions in germinating cut12.d1 spores. Haploid spores prepared from a cut12+/cut12.d1 diploid were germinated in minimal medium lacking uracil at 30°C and processed for immunofluorescence from 12 to 22 hr after inoculation. Shown are three cells fixed 16 hr after inoculation. (A) Phase/DAPI reveals cell outline and chromatin; (B) anti-tubulin staining; (C) anti-Sad1 staining. Germinating cut12.d1 spores appeared to contain two foci of Sad1 staining, although the microtubules arose from a position distal to both foci, indicated by an arrow for each of the three cells. Cells also underwent cut divisions (cell 3). Scale bar, 10 μm. (d–i) Monopolar spindle formation and cut divisions following the switch off of plasmid borne cut12+ expression in cut12.d1 haploid cells. A culture of the cut12.d1 haploid maintained by the expression of a plasmid borne copy of the cut12+ cDNA from the attenuated thiamine repressible nmt1+ promoter was grown to log phase in minimal medium in the absence of thiamine at 30°C. Aliquots were then inoculated into thiamine-free media to allow continued expression of cut12+, and a second aliquot inoculated into medium containing thiamine to repress cut12+ expression. Samples were processed for immunofluorescence from 14 to 28 hr later. (d,f,h) cut12+ expressed; (e,g,i) cut12+ repressed. (d,e) Phase/DAPI reveals cell outline and chromatin staining; (f,g) anti-tubulin staining; (h,i) anti-Sad1 staining. Defective spindles formed in cells ∼14 hr after repression of cut12+. Monopolar spindles arose from only one of the two Sad1 foci (cell 1 and 2), similar to the ts cut12.1 mutant, and Cut divisions occurred (cell 3). Scale bar, 10 μm. (j–l) Immunofluorescence analysis of cells overexpressing cut12+. Cells carrying the cut12+ cDNA linked to the wild-type nmt1+ promoter of the pREP1 plasmid were grown to mid log phase, the culture was divided in two, and cut12+ expression was derepressed in one half. Samples were taken every hour from 12 to 20 hr following induction. Shown are cells in which cut12+ was derepressed for 16 hr. (j) Phase contrast/DAPI stain; (k) anti-tubulin staining; (l) anti-Sad1 staining. Cells overexpressing the cut12+ gene formed monopolar spindles that seemed to arise from the single focus of Sad1 staining visible within the cell. Cells in which cut12+ expression was repressed formed normal bipolar spindles (not shown). Scale bar, 10 μm.