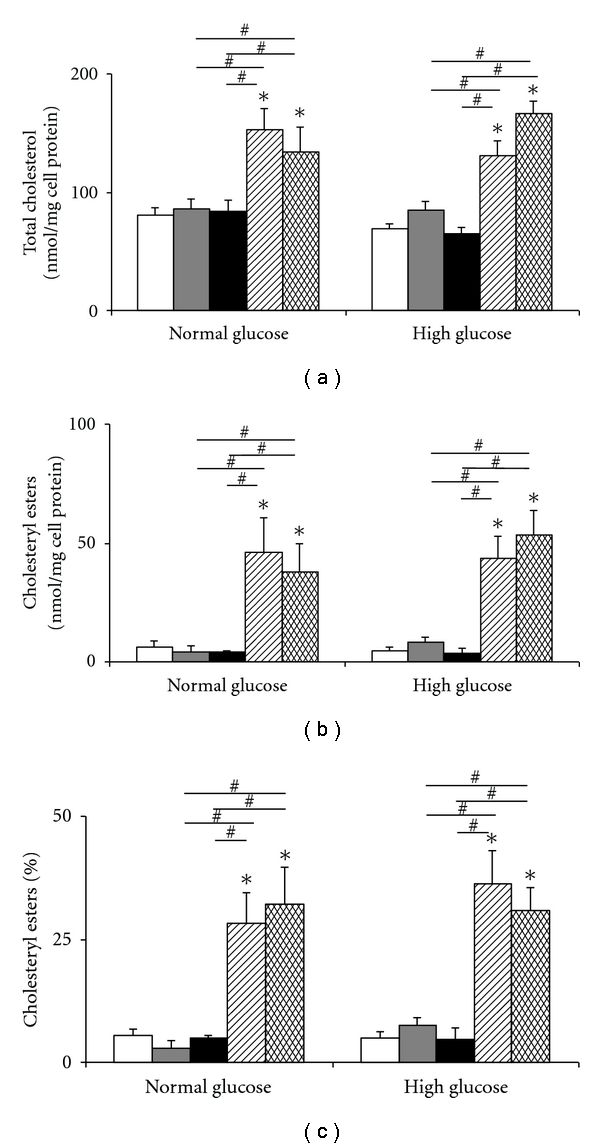
Figure 5.

Effect of maturation in 5 versus 30 mM glucose on the accumulation of total cholesterol (a), cholesteryl esters (b) and percentage cholesteryl esters (c), quantified by mass using HPLC, in HMDM cells after exposure to native LDL (white bars), incubation control LDL (LDL incubated with EDTA: EDTA-LDL, gray bars), or modified LDL preglycated with 10 (black bars), 50 (striped bars) or 100 mM (hatched bars) glycolaldehyde. Data are mean ± SEM of three or more experiments. *P < 0.05, and # P < 0.05 as compared to other treatments, using one-way ANOVA and Newman-Keuls multiple comparison test.
