
Figure 4.
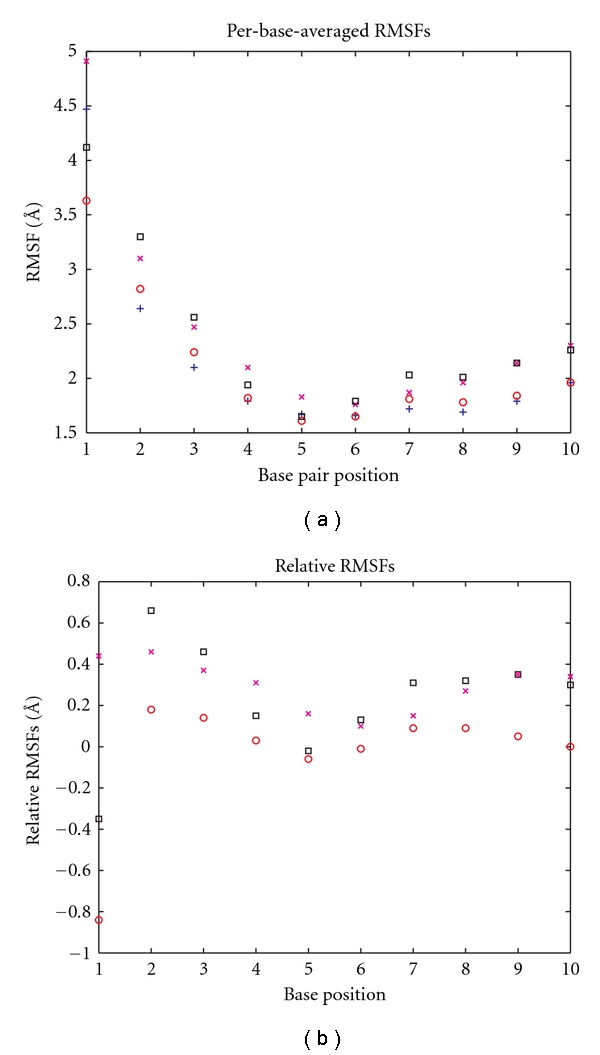
(a) Per-base-averaged RMSFs. The atomic root-mean-square fluctuations for the first ten bases for each of the DNA sequences are depicted: matched DNA as blue +s, T mismatched as red °s, dU mismatched as magenta ×s, and FdU mismatched as black squares. (b) Per-base-averaged RMSFs relative to matched DNA as (a), but with the matched DNA rmsf values subtracted.