
Figure 3.
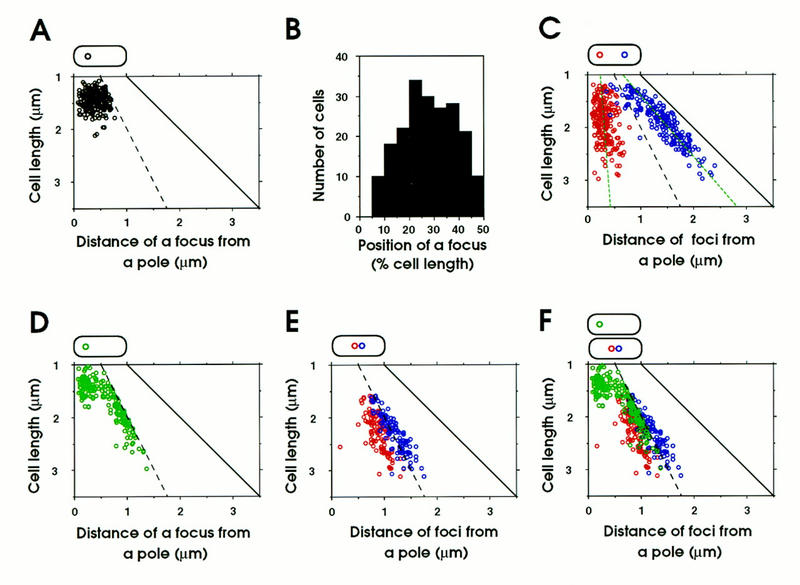
Analysis of intracellular distribution of replication origin and terminus in cells. Fixed cells were hybridized with a Cy3-labeled DNA probe. (A) Cells with a single fluorescent focus of oriC–gid. The distance between the center of the focus and the nearest pole was plotted versus cell length (n = 200). (B) Histogram of position of the oriC–gid focus in cells with a single focus. Position of the focus is given as a percent of cell length (n = 200). (C) Cells with two fluorescent ori–gid foci. The positions of the foci from a pole are plotted (red and a dark blue circles) versus cell length (n = 200). The green broken lines indicate regression lines. (D) Cells with one fluorescent focus of the terminus DNA segment (n = 200). (E) Cells with two fluorescent foci of the terminus DNA segment (n = 200). (F) Combination of D and E. The black broken line indicates midcell and the black solid line indicates the position of a pole.